AI Isn’t a GoldRush. It’s CasinoChipping: The House Runs on Silicon, Power & Policy.
Dr. Anju Sharma | MrsSustainability | KtalystInsights™
1️⃣ The House Always Wins InfrastructureConcentration45%.
That’s how much of Taiwan’s equity market leans on Taiwan Semiconductor Manufacturing Company.
In Korea?
Two names:
✓Samsung Electronics +
✓SK Hynix
KOSPI weightage40%
KtalystKlues:
✓ ~62% global foundry share (TSMC)
✓ ~92% advanced-node dominance
✓ ~70% global DRAM controlled in Korea
✓ $220B+ annual AI-linked semiconductor capex
This isn’t a tech rally.
This is infrastructure concentration risk.
2️⃣ All AI Roads Don’t Lead to Apps. They Lead to Fabrication.
Bloomberg quotes it cleanly: “All AI roads lead to TSMC.
Not Nvidia.
Not OpenAI.
Not the interface layer.
AI looks like software.
But behaves like a toll system. (AI_Tolls)
Apps compete loudly.
Foundries price quietly.
The players feel glamorous.
The house is mathematical.
3️⃣ AI Is Not CloudLight. It’s GridHeavy.
A single advanced fab draws 100–160 MW. That’s a small city!
By YR2030:
✓ U.S. data centers could consume 8–10% of national power
✓ Top Taiwanese fabs use 150,000 tons of water/day
Let’s be clear:
If electricity tightens → AI slows.
If water tightens → fabrication stalls.
AI acceleration is now an energy allocation debate.
The casino runs on power.
And power has politics.
4️⃣ Enter PaxSilica — The MembershipCasino
✓Export controls.
✓Tooling restrictions.
✓Trusted trade corridors.
Semiconductors are no longer just products, they’re geopolitical leverage.
✓ One export rule → 5–10% stock swing
✓ One tooling restriction → supply chain re-rating
✓ One diplomatic thaw → valuation expansion
That’s not volatility.
That’s policy embedded in multiples.
Membership matters now.
5️⃣ The Real Bet: Ownership of the Floor
When 40–45% of an index leans on a fabrication house:
✓ Growth amplifies
✗ So does systemic exposure
This AI era isn’t about who builds the smartest model.
It’s about:
Who owns fabrication
Who controls energy
Who secures water
Who shapes policy corridors
Who underwrites the grid
Investors think they’re betting on innovation.
They’re betting on the house.
And the house runs on:
Silicon.
Electricity.
Water?
Policy.
AI isn’t just compute.
It’s concentrated capital + constrained resources + controlled corridors.
That’s not a bubble.
That’s a casino with infrastructure moats.
Infrastructure never plays short-term.
Dr. Anju Sharma
KtalystInsights™ | MrsSustainability | EnergyEconomics | PaxSilica | AIInfrastructure
DataComa
GreenLove
5Ps 5Es
Originally published on LinkedIn on 2026-02-13 03:34:10: https://www.linkedin.com/feed/update/urn%3Ali%3AgroupPost%3A1910576-7427917977506770944
AI Isn’t a GoldRush. It’s CasinoChipping: The House Runs on Silicon, Power & Policy.
Dr. Anju Sharma | MrsSustainability | KtalystInsights™
1️⃣ The House Always Wins InfrastructureConcentration45%.
That’s how much of Taiwan’s equity market leans on Taiwan Semiconductor Manufacturing Company.
In Korea?
Two names:
✓Samsung Electronics +
✓SK Hynix
KOSPI weightage40%
KtalystKlues:
✓ ~62% global foundry share (TSMC)
✓ ~92% advanced-node dominance
✓ ~70% global DRAM controlled in Korea
✓ $220B+ annual AI-linked semiconductor capex
This isn’t a tech rally.
This is infrastructure concentration risk.
2️⃣ All AI Roads Don’t Lead to Apps. They Lead to Fabrication.
Bloomberg quotes it cleanly: “All AI roads lead to TSMC.
Not Nvidia.
Not OpenAI.
Not the interface layer.
AI looks like software.
But behaves like a toll system. (AI_Tolls)
Apps compete loudly.
Foundries price quietly.
The players feel glamorous.
The house is mathematical.
3️⃣ AI Is Not CloudLight. It’s GridHeavy.
A single advanced fab draws 100–160 MW. That’s a small city!
By YR2030:
✓ U.S. data centers could consume 8–10% of national power
✓ Top Taiwanese fabs use 150,000 tons of water/day
Let’s be clear:
If electricity tightens → AI slows.
If water tightens → fabrication stalls.
AI acceleration is now an energy allocation debate.
The casino runs on power.
And power has politics.
4️⃣ Enter PaxSilica — The MembershipCasino
✓Export controls.
✓Tooling restrictions.
✓Trusted trade corridors.
Semiconductors are no longer just products, they’re geopolitical leverage.
✓ One export rule → 5–10% stock swing
✓ One tooling restriction → supply chain re-rating
✓ One diplomatic thaw → valuation expansion
That’s not volatility.
That’s policy embedded in multiples.
Membership matters now.
5️⃣ The Real Bet: Ownership of the Floor
When 40–45% of an index leans on a fabrication house:
✓ Growth amplifies
✗ So does systemic exposure
This AI era isn’t about who builds the smartest model.
It’s about:
Who owns fabrication
Who controls energy
Who secures water
Who shapes policy corridors
Who underwrites the grid
Investors think they’re betting on innovation.
They’re betting on the house.
And the house runs on:
Silicon.
Electricity.
Water?
Policy.
AI isn’t just compute.
It’s concentrated capital + constrained resources + controlled corridors.
That’s not a bubble.
That’s a casino with infrastructure moats.
Infrastructure never plays short-term.
Dr. Anju Sharma
KtalystInsights™ | MrsSustainability | EnergyEconomics | PaxSilica | AIInfrastructure
DataComa
GreenLove
5Ps 5Es
Source / shared link: https://www.bloomberg.com/news/articles/2026-02-13/ai-angst-in-us-stocks-sends-global-money-chasing-asia-s-winners
Originally published on LinkedIn on 2026-02-13 03:32:39: https://www.linkedin.com/feed/update/urn%3Ali%3Ashare%3A7427917596898775040
GreenGreed & CleanGrids 🍃
Dr. Anju Sharma | MrsSustainability | KtalystInsights
I was reading an engaging Bloomberg piece & hit like a plot twist: coal_based grid consumption in China & NamasteIndia is on a downward pivot. Not because coal suddenly became unpopular but because the grid is getting new muscles: more renewables, better dispatch, and harder economics.
Plot twist: “Green” has two meanings.
🟢 PlanetGreen = clean electrons
💵 DollarGreen = who pays + who profits
And the grid? TheGrid only respects24/7 electricity.
1) CoalGoal = “No Blackouts” Goal 🪨⚡
Coal isn’t the dream. Coal is the backup friend when solarghosts you at 7pm.
✓ Night-time demand + evening ramp
✓ Heatwaves + peak load panic
✓ Factory spikes + weekday surges
✓ Gas prices acting spicy
✗ Coal doesn’t “win” because it’s loved
✗ Coal wins when storage + transmission are late
2) Is fossil fuel getting retired?
Not fully. But the old privilege is.
✓ “Operate” now needs a plan: emissions + affordability + security
✓ Financing is harder for high-emission, high-cost assets
✗ The era of “Burn first, explain later” is fading
✗ Fossil is no longer default — it’s case-by-case
3) The uncomfortable globalmath 🌍
Coal is still mostly an Asia story.
✓ China + India ≈ ~70% of global coal use
✓ So global coal decline = Asia’s grid upgrade story
✗ Speeches don’t bend coal curves
✗ Only systems do: transmission, storage, flexible markets
4) YR2025 → YR2030: AIEeeks
Demand rises anyway (AC + EVs + industry). AI adds the “always-on” layer.
✓ Data centres = electricity gyms (always training, always hungry)
✓ Forecast: data-centre power use could ~double by 2030 (~945 TWh)
✗ This isn’t just “more electricity
✗ It’s more 24/7 electricity (firm power becomes valuable)
5) The real battle: Clean vs Chaos ⚡
Not green vs coal. It’s grid-ready vs grid-wishful.
✓ Renewables (cheap energy)
✓ Storage (night + peaks)
✓ Smart grids (less waste)
✓ Transmission (move power where needed)
✓ Some firm power (until storage scales)
✗ A “clean” grid that can’t survive 7pm
✗ A transition built on vibes, not infrastructure
If your ‘green’ can’t survive 7pm, it’s not a transition, it’s a mood.” Dr. Anju Sharma
Originally published on LinkedIn on 2026-01-29 11:05:47: https://www.linkedin.com/feed/update/urn%3Ali%3AugcPost%3A7422595814646251520
YR2030:Metamorphosis_Beyond_DataComa
Dr. Anju Sharma | KtalystInsights
We are no longer in a market cycle.
We are inside a $20 trillion structural pivot of the global economy.
Strategies built on 2024 assumptions are now ghost maps for 2026 realities.
Welcome to the LogisticalDecade.
9 seismic shifts redefining trade, profitability & power 👇
1️⃣ PaxSilica | Security beats efficiency (Integration)
✓ Economic security = national security
✗ Lowest-cost sourcing is no longer king
Corporates are trading ~2% efficiency for 100% reliability via trusted corridors.
📌 Resilience is the new ROI.
2️⃣ CBAM | The carbon tariff wall (Regulatory Integration)
CBAM isn’t climate policy—it’s a trade barrier priced in carbon.
✓ 20–30% margin erosion for non-compliance
✓ Green hydrogen = profit insurance
📌 Carbon is the new customs duty.
3️⃣ Net Zero vs Profitability | The great Decoupling (Operation)
✓ H1-2025 climate losses > $165B
✓ Unsustainable assets = un-insurable
✓ Circular models cut ~15% volatility costs
📌 Net Zero is profit defence, not virtue.
4️⃣ NewEnergyWorld | $3.2T sovereignty race (Operation)
Energy is now strategic infrastructure, not a commodity.
✓ Global energy capex > $3.2T/year
✓ HV transformer waits: 3–4 years
📌 Power security = growth security.
5️⃣ Compute | The new factor of production
✓ AI data-centre capex: $6–7T by 2030
✓ Compute-led productivity: +$15–20T GDP
📌 Compute isn’t IT. It’s macroeconomics.
6️⃣ Workforce | From headcount to AgenticFlow (Inversion)
✓ New KPI: compute-per-employee
✓ ~40% productivity gains for early adopters
✓ India: body-shopping → model orchestration
📌 Productivity units changed.
7️⃣ Critical minerals | Lithium_Silicon chokehold
✓ Copper, lithium, graphite demand +400% by 2030
✓ China controls 70–90% of processing
📌 Material sovereignty is the new moat.
8️⃣ Capital | The return of Discipline (Valuation Inversion)
✓ Cash flow > narratives
✓ Profitability > scale
✓ Policy-aligned subsidies steer $100B+ profit pools
📌 Capital follows policy before passion.
9️⃣ Methane heat-mapping | The invisible margin leak (Operation)
✓ Methane = ~84× CO₂ (20-yr basis)
✓ 3–5% gas routinely lost
✓ Fixes often <12-month payback
📌 Dirty assets don’t fail morally. They fail financially.
KtalystInsights
Transition YR2026_2030 is logistical, not ideological.
Winners will integrate Strategy × Policy × Finance × Sustainability
into anti-fragile operating systems.
Sustainability is no longer a cost centre. It is your license to trade—and your right to insure. Dr. Anju Sharma
DataComa PaxSilica CBAM MethaneMath
NetZeroProfitability IndiaEnergyTransition
KtalystInsights MrsSustainability
Originally published on LinkedIn on 2026-01-14 14:26:10: https://www.linkedin.com/feed/update/urn%3Ali%3Ashare%3A7417210422333902850
Engine_Drinks_from_the_Fields | On Track to YR2030?
GlobalOutlook | Top7 Biofuel-Producing Countries
(by Dr. Anju Sharma | MrsSustainability)
Biofuels are now a mainstream pillar of the global energy transition — not a supplement.
🔹 Global demand: +25–30 % by 2030 → ~200 Bn L Ethanol + 70 Mt Biodiesel (OECD-FAO 2025–34)
🔹 Asia Rising: NamasteIndia + Indonesia + China = 50 % of incremental demand
🔹 Advanced biofuels (cellulosic / algal / SAF): < 2 % → ≈ 10 % share by 2030 (aviation + marine mandates)
🔹 NetGHGImpact: ≈ 1.2 Bn boe displaced | > 350 Mt CO₂ cut annually
🔹 InvestmentTrend: Global CAPEX > USD 50 Bn (2024) → 2× by 2030
NetGHG impact: Biofuels could displace ≈ 1.2 billion barrels of oil equivalent annually, cutting CO₂ emissions by > 350 million tonnes per year.
The next five years will define how efficiently countries connect farm economics to fuel security.
The world’s fuel mix is changing, quietly but decisively. Biofuels now contribute over 5 % of transport energy globally, and nations are scaling up blending mandates to cut emissions, diversify energy, and strengthen rural economies.
Top7 biofuel-producing countries stand in 2025:
USA
Global share: ~38 % of total biofuel output
Ethanol: ≈ 59 billion L (from maize)
Biodiesel: ≈ 19 % of world supply (soybean oil & waste oils)
Blend mandate: E10 nationwide; E15–E85 in flex-fuel vehicles
Outlook: Renewable Fuel Standard targets > 79 billion L by 2026
Brazil
Global share: ~24 % ethanol, 12 % biodiesel
Blends: E30 ethanol and B15 biodiesel (2025)
Feedstocks: Sugarcane, soybean oil
Policy: RenovaBio incentivizes carbon-intensity reduction via tradable decarbonization credits
NamasteIndia 🇮🇳
Rank: 3rd largest ethanol producer (~ 6 billion L)
Blend: Nationwide E20 rollout (April 2025)
Feedstock: Molasses, maize, damaged grains
Policy: Ethanol Blended Petrol Programme; flex-fuel vehicles mandated from 2024
EU
Global share: 5 % ethanol, 36 % biodiesel
Output: ~ 25 billion L (biodiesel) + 6 billion L (ethanol)
Feedstock: Rapeseed oil, waste oils, sugar beet
Policy: Renewable Energy Directive III — 42.5 % renewables in total energy by 2030
China
Global share: 8 % ethanol, 3 % biodiesel
Blends: E10 in major provinces; SAF export quotas in 2025
Feedstock: Maize, used cooking oil
Outlook: Scaling SAF and bio-methanol capacity for aviation and shipping
Indonesia
Global share: 10 % of biodiesel output
Blend: B40 implemented (2025); E10 pilot under review
Production: ≈ 12 million tonnes biodiesel (palm oil base)
Target: B50 by 2028 under Indonesia Bioenergy Roadmap
Canada
Global share: ~ 1.6 % ethanol, 1.4 % biodiesel
Blend: E10–E15; B5–B10
Feedstock: Maize, wheat, waste oil, forest residues
Focus: Investment in cellulosic biofuels and low-carbon liquid fuel standards
By YR2030, the world may not just refill at petrol pumps, it will be recharged by the planet itself?
Originally published on LinkedIn on 2025-10-30 22:13:09: https://www.linkedin.com/feed/update/urn%3Ali%3AgroupPost%3A121193-7389786467960602624
Sustainability2025: From Voluntary Promises to Regulatory Mandates
For decades, sustainability was about goodwill—voluntary pledges, philanthropy, or brand polish. Companies that cared were seen as pioneers. Governments spoke in pledges, NGOs carried the torch.
YR2025, Sustainability is now law, enforced by regulators, priced by markets, and demanded by societies.
1. EarlyEchoes (1700s–1980s)
Guidance only, no enforcement.
1713: Carlowitz coined Nachhaltigkeit (sustained forestry).
1972: Stockholm Conference raised global awareness.
1987: Brundtland Report defined sustainable development.
2. GlobalFrameworks (1990–2010) By 2005, <20% of Fortune 500 issued sustainability reports.
1992: Rio Earth Summit, Agenda 21.
2000: Millennium Development Goals (8 targets, no penalties).
2005 to 2010 Corporate tools: WBCSD’s Triple Bottom Line, GRI standards.
3. From Reports_to_Risks (2010–2015) OECD warned $90 trillion in climate-exposed infrastructure.
2010: ISO 26000 set out social responsibility.
2015: Paris Agreement—195 nations pledged emission cuts.
2015: UN SDGs—17 goals, 169 targets.
4.RegulatoryMandates(2015–2025)
YR2025, over 80 countries mandate ESG disclosure.
EU CSRD (2024): 50,000+ firms must disclose ESG performance.
IFRS ISSB: Adopted in Canada, UK, Singapore as baseline law.
India: SEBI BRSR (top 1,000 firms), RBI green finance frameworks.
Penalties: Shein fined €1M (Italy), Clorox fined A$8M (Australia).
5. Why the Shift?
Science: Warming already at 1.1°C.
Economics: $300B annual climate disaster costs (World Bank).
Society: 200M climate migrants projected by 2050 (UNHCR).
Markets: 85% of investors use ESG in decisions (PwC).
Trust: Greenwashing eroded credibility, forcing regulation.
6. The WorldToday Concern has turned into compliance
Courts treat greenwashing as fraud.
Net-zero pledges now cover 90% of global GDP.
Cost of capital increasingly tied to ESG ratings.
7. YR2030 Sustainability is shifting from checkbox to operating system.
Integrated accounting: ESG data in audited reports.
CarbonMarkets: Projected $100B+ by 2030.
ESG-linked loans: Already $1.5T market.
Circular economy: $4.5T opportunity by 2030 (Accenture).
What began as promises for posterity are now policies for prosperity.” — Dr. Anju Sharma
Originally published on LinkedIn on 2025-09-08 04:37:28: https://www.linkedin.com/feed/update/urn%3Ali%3AgroupPost%3A82951-7370676626881208322
🔋🌞 NamasteIndia Rising: From Watts to Wonders!
KtalystInsights | RenewableIndia | EnergyTransition | Mission500GW | GreenGrowth
Scaling up isn’t about doing more. It’s about doing different, faster, and smarter.
India’s clean energy story isn’t a whisper anymore. It’s a power surge ⚡
According to the Ministry of New & Renewable Energy (MNRE), here’s how we’ve charged ahead from 2014 to 2025:
📊 RE Capacity Growth (MW)
☀️ Solar: 2.8 GW ➜ 110.8 GW
🌬️ Wind: 21 GW ➜ 51.3 GW
♻️ Bio-Energy: 8.2 GW ➜ 11.6 GW
That’s over 173GW by YR2025—a 5X leap from 2014!
But here’s the catch 👉
India’s YR2030 target = 500GW non-fossil fuel power.
We’re barely 35% there. Time to level up.
🎯 What We Still Need by 2030:
🔸 170–190 GW more in Solar ☀️
🔸 89 GW more in Wind 🌬️
🔸 20+ GW in Bio/Hybrid/Small Hydro ♻️
⚠️ The Bottlenecks?
Delayed PPAs & grid bottlenecks
Low investment in storage, offshore, and bioenergy
Land acquisition & infra hurdles
💡 KtalystInsights Takeaway:
We’ve built the panels. Now let’s power the ambition.
The future isn’t just renewable—it’s India-made, digitally managed, and net zero aligned.
Who’s leading the charge?
Tag your RE champions and let’s talk Mission2030 👇
Originally published on LinkedIn on 2025-07-03 01:37:28: https://www.linkedin.com/feed/update/urn%3Ali%3AgroupPost%3A82951-7346351339515305984
🌍 NamasteIndia’s Emerging 2025TrendsGreenTechOutlook 🇮🇳
From coastal corridors to global climate leadership, India is positioning itself as a hub for green hydrogen, ammonia, and clean energy exports.
📌 Key Trend: GreenHydrogen is not just a domestic ambition—it’s India’s new global growth story.
🔹 Top India-HQ Players Leading the Shift:
1. AMGreen – Launches the Kakinada green ammonia project (0.5–1 MTPA), with plans to supply 20% of Europe’s green ammonia by YR2030.
2. Reliance – GigaScale hydrogen from Jamnagar.
3. AdaniGreen – Scaling from 13.48 GW to 45 GW of renewables by 2030, driving integrated hydrogen-ammonia systems.
4. BPCL & LarsenToubro – Building electrolyzers, mobility hubs, and infrastructure from Kochi to Mundra.
5. NTPCGreen – Powering public-sector scale, with targets of 100,000 tonnes/year of green hydrogen.
6. Startups – Log 9 Materials and Green Trek are pioneering graphene fuel cells and sustainable steel.
📈 Emerging 2025Trends:
✅ Export-first ammonia & hydrogen corridors to Europe, Japan, and Singapore
✅ Indigenous electrolyzer manufacturing reducing costs by 30%
✅ Sector-wide decarbonization across fertilizers, aviation, and shipping
✅ Startup and public-private collaboration shaping India’s green edge
🔎 What’s Driving It:
📊 India’s green hydrogen market projected at $8B by YR2030!
🏛️ NationalGreenHydrogen Mission ($2.4B) + PLI schemes + global MOUs
🌞 Lowest solar costs globally (~$0.03/kWh), making green fuels viable
💬 India’s GenZ workforce, global investors, and policy leaders are aligning with one goal: Sustainable growth, exported at scale.
📢 What should India prioritize next—electrolyzer R&D, green steel, or global alliances?
Originally published on LinkedIn on 2025-05-28 11:39:24: https://www.linkedin.com/feed/update/urn%3Ali%3Ashare%3A7333456858675867648
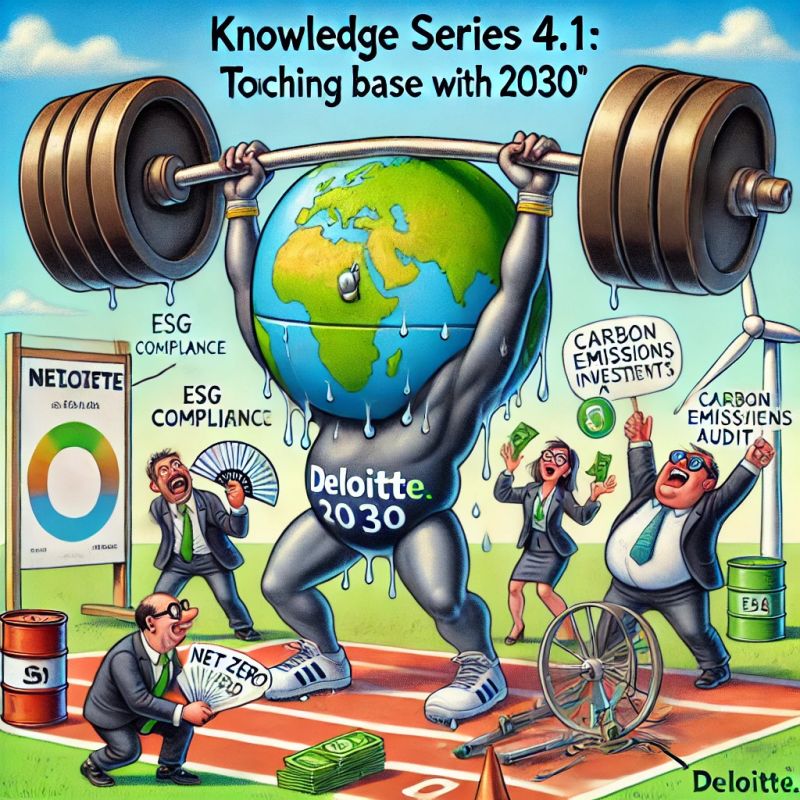
KnowledgeSeries 4.1: Deloitte – Touching Base with Sustainability 🌍♻️
🚀 Deloitte’s Green Footprint
One of the Big Four, Deloitte is at the forefront of ESG and sustainability with bold goals, smart strategies, and data-driven outcomes.
🌱 Vision for a Sustainable Future
> “Sustainability is no longer an option—it’s an imperative.” – Deloitte Insights
Operating in 150+ countries, Deloitte offers consulting, strategy, and finance services to help businesses navigate climate risks and ESG challenges.
Core_Focus_Areas:
✅ Net Zero & Decarbonization
✅ ESG Strategy & Governance
✅ Sustainable Finance
✅ Reporting & Impact Metrics
📊 Key Numbers That Matter
Net_Zero by YR2030
82% drop in travel emissions since 2019
47% cut in energy use across offices
100% renewable energy goal by 2025
$1B for Sustainability Services
Advising 1000+ global firms
Co_developed WEF ESG Metrics
People & Purpose
50% carbon footprint reduction by 2030
40+ CSR hours/employee annually
50% women in leadership target
📑 Insights from Deloitte Reports
2024 Sustainability_Action_Report
98% of companies progressing on ESG goals
56% formed ESG taskforces
2022 CxO Report
89% execs see climate as an emergency
67% increased ESG investments
FTSE 100 ESG Recalibration
46% companies revised their ESG scores
SDG Impact
Aligned with 12 of 17 SDGs, focusing on climate, consumption & governance
🔧 Deloitte’s 4-Step ESG Playbook
1️⃣ Measure carbon & ESG impact
2️⃣ Optimize operations for sustainability
3️⃣ Decarbonize with tech & renewables
4️⃣ Report to global standards (GRI, TCFD, WEF)
The Sustainability Reporting Catalyst helps companies comply across 60+ countries
🔭 What’s Next?
Green Finance innovation
AI for ESG data
Circular economy solutions
Renewable energy scaling
🌱 Deloitte isn’t just consulting on sustainability—it’s living it.
Next in KnowledgeSeries 4.1: Deloitte’s Green Power Play! ♻️
Which Big Four firm is leading the ESG charge? Let us know!
Originally published on LinkedIn on 2025-03-21 08:55:37: https://www.linkedin.com/feed/update/urn%3Ali%3AgroupPost%3A7041748-7308773265890566146
🚀 NamasteIndiaMobilityMarket to Exceed $600B by YR2030
Revolutionizing Growth through Electrification & Innovation
The Indian mobility industry is charting its unique course, poised to double and surpass $600B by 2030, with $100B fueled by emerging revenue streams.” — Google-BCG Report
🔑 KeyInsights
💰 RevenueProjections
Classic Revenue Pools:
🔧 ClassicComponents: $65B (+$23B).
🚙 NewSales (ICE Vehicles): $120B (+$33B).
🔄 ClassicAftersales: $162B (+$71B).
💳 Financing&Insurance: $133B (+$59B).
Emerging Revenue Pools:
⚡ BEV&AVComponents: $25B (+$20B).
🌍 NewSales (BEVs): $37B (+$33B).
🔧 NewAftersales: $8B (+$8B).
🚖 NewMobilitySolutions: $62B (+$37B).
👥 ConsumerTrends
⚡ EVAdoption: 1 in 3 planning to buy EVs.
🌸 WomenDriveChange: Women lead 52% of EV purchase decisions.
🌿 WhyItMatters
India’s mobility market is transforming through Sustainability & Electrification. Both classic & emerging revenue pools are converging to shape a global leader in MobilityInnovation.
👉 Are you ready to ride the wave?
Let’s lead the FutureOfMobility! EVs Growth Sustainability BCG Google
Source / shared link: https://m.economictimes.com/industry/auto/auto-news/india-mobility-market-to-double-surpassing-600-mn-by-2030-google-bcg-report/articleshow/117354350.cms
Originally published on LinkedIn on 2025-01-20 13:19:59: https://www.linkedin.com/feed/update/urn%3Ali%3AgroupPost%3A60128-7287096526823153664

