Banks_Blooming_with_Green_Fee(But Not Everywhere)
Dr. Anju Sharma | KtalystInsights™ | KtalystKlues™
Bloomberg confirms a structural shift in 2025, GreenFees overtook Fossil-linked fees $3.7B vs $2.9B.
What Matters
TotalTees fell vs YR2024, as US_banks_stepped_back from climate alliances post-Trump’s return?
KtalystKlues:
1) EU Banks Power the Fee Engine
🟢 Largest green fee pool globally
🟢 Sovereign + corporate issuance at scale
🟢 Regulation = predictable deal flow
🔴 Minimal reliance on “voluntary ESG
Who captures fees?
BNP Paribas | Crédit Agricole | Deutsche Bank |
Why they win:
✔ Early ESG structuring
✔ In-house carbon & covenant expertise
KtalystKlues™: Europe scaled green fees. They didn’t lose them.
2) US Scale Wins, Regionals Miss Out
🟢 Structuring-heavy SLBs & transition bonds
🟢 Deep investor pools = premium pricing
🟢 Global underwriting reach
🔴 Deal flow volatility post climate exits
Fee winners:
JPMorgan Chase | Bank of America | Morgan Stanley
What holds regionals back:
✗ Vanilla lending
✗ Thin ESG structuring skills
KtalystKlues™: In the US, capability beats proximity.
3) China Volume Over Pricing Power
🟢 Policy-mandated issuance
🟢 State balance sheets guarantee scale
🟢 Multi-currency green bonds
🔴 Limited fee innovation
Dominators:
ICBC | Bank of China | CITIC Securities
KtalystKlues™: China earns green fees by volume certainty, not differentiation.
4) Japan — Predictable, Not Explosive
🟢 Samurai green bonds
🟢 Infra-linked transition finance
🟢 Conservative risk culture
Anchors:
Mizuho | MUFG
₹KtalystKlues™: Japan runs green finance like pensions—slow, steady, reliable.
5) NamasteIndia — Local Risk, Global Fee Capture
🟢 Fastest-growing green capex market
🟢 Sovereign green bonds crossed $5.7B (2024)
🔴 Domestic underwriting depth still thin
🔴 Fees migrate offshore
Who earns the fees:
HSBC | Citi | JPMorgan
Who carries the risk:
SBI | ICICI Bank | Axis Bank
India’s Green Fee Unlock 🔓
🟢 Deeper SEBI green taxonomy
🟢 PSU balance-sheet reform
🟢 Stronger domestic investor base
🟢 Rupee green-bond liquidity
KtalystKlues™: India builds green assets but exports green fees. Policy × capability = India’s green-fee moment.
What’s DecliningFastGlobally
🔴 Fossil project-finance underwriting
🔴 Plain-vanilla corporate bonds
🔴 Banks without ESG structuring depth
KtalystKlues™: Green didn’t just grow. It replaced old fee pools.
The RealDifferentiator (NoGreenwashing)
🟢 Carbon accounting embedded in deals
🟢 Sustainability-linked covenants
🟢 Cross-currency green structuring
🔴 Legacy DCM skillsets
KtalystKlues™: Green finance rewards risk pricing skill, not slogans.
Green banking fees aren’t rising everywhere. They’re migrating to skill clusters. –Dr. Anju Sharma
Originally published on LinkedIn on 2026-01-04 14:57:08: https://www.linkedin.com/feed/update/urn%3Ali%3Ashare%3A7413594337663688704
TheChemical_Industry generated ~USD57billion in net profits and invested ~USD73billion in CAPEX in YR2024, yet TSR remains structurally weak. WHY?
Dr. Anju Sharma
KtalystInsights™ MrsSustainability
KtalystKlues
This is not a DemandParadox; it is a ValueCapture problem.
1) The industry is still profitable
✓ Global Top-50 chemical companies reported #~USD57billion net profit in 2024
✓ Average sector EBITDA margins ~12–15% for large integrated players
✓ A majority of listed chemical companies remained cash-positive despite margin pressure
KtalystInsights:
Profitability exists; this is not a demand-led downturn.
2) Capital investment has not stopped
✓ Global chemical CAPEX in 2024: ~USD73billion (Top-50 companies)
✓ R&D spend grew ~2–4% YoY in 2024 despite earnings pressure
KtalystInsights:
Industries facing structural demand decline do not sustain this level of investment.
3) Volumes are growing faster than pricing
✓ Global chemical market size grew from #~USD6.18trillion (2024) to #~USD6.32trillion (2025E)
✓ Packaging, electronics, mobility & construction chemicals showed #~1.5–3% volume growth
✓ Real pricing power across bulk and semi-specialty chains remained flat to negative
KtalystInsights:
Demand growth exists, but value per unit has diluted.
4) TSR is weak because capital intensity has risen
✓ Chemical sector 5-year TSR ~2–3% p.a. vs #~8–9% for MSCI World
✓ Average CAPEX-to-sales ratio increased ~150–250 bps vs pre-2015 levels
✓ Energy transition and ESG CAPEX raised fixed costs without near-term pricing upside
KtalystInsights:
Returns compress when each dollar of profit requires more capital.
5) Overcapacity is real—but uneven
✓ China accounted for #~40%+ of global new petrochemical capacity additions (2019–2024)
✓ Utilisation in multiple commodity chains remains #~70–80%, below mid-cycle norms
✓ Specialty chemicals show #~40–50% lower EBITDA volatility vs commodity chemicals
KtalystInsights:
McKinsey’s conclusion fits commodity and aging specialty chains, not the entire sector.
6) Segment data shows divergence, not uniform decline
✓ Regulation-linked chemicals often sustain ROIC in the high-teens to low-20% range
✓ Application-embedded specialties outperform sector TSR by ~300–500 bps
✓ Commodity chemicals trend at or near cost of capital
KtalystInsights:
The issue is business-model selectivity, not sector weakness.
7) What McKinsey measures vs what boards must decide
✓ McKinsey evaluates relative investor returns (TSR)
✓ Boards must manage absolute cash generation and capital efficiency
✓ Demographics support demand; strategy decides economic rent
KtalystInsights:
Chemicals are essential—but not all are equally rewarded.
> This is not a low-demand cycle.
It is a high-capital, low-pricing-power environment.
Dr. Anju Sharma
KtalystInsights™ MrsSustainability Chemicals Strategy ValueCapture TSR BoardroomLens DataComa
Originally published on LinkedIn on 2025-12-28 10:35:57: https://www.linkedin.com/feed/update/urn%3Ali%3Ashare%3A7410991894211543040
🚨 BigBrands, BIGGERFines: The Recycling Greenwashing Scandal Exposed! ♻💰
We’ve been told recycling is the answer to plastic waste. But what if the system itself is built on fraud and deception? BigBrands are now facing BIGFINES for misleading consumers about recyclability. Here’s how the deception unfolded over the years:
📅 TIMELINE OF GREENWASHING IN RECYCLING
🔹 YR1990s – The Recycling Illusion Begins
📌 Plastic industry documents reveal that producers knew recycling wouldn’t work on a large scale—but they marketed it as the solution to keep plastic production high. (Source)
🔹 YR2000s – Growth of the ‘Recyclable’ Label
📌 Brands like CocaCola, Nestlé, and Unilever start aggressively using recyclable labels, despite knowing that most plastic isn’t actually recycled due to contamination and lack of facilities. (Source)
🔹 YR2018 – China Bans Plastic Waste Imports
📌 China’s NationalSword policy ends global reliance on cheap recycling, exposing the broken system. The US and EU struggle to process their own plastic waste.
🔹 YR2022 – Keurig Faces Greenwashing Lawsuit
📌 KeurigDrPepper pays #$3M in Canada and $1.5M in the US for falsely claiming its K-Cups were recyclable, despite most recycling centers rejecting them. (Source)
🔹 YR2023 – EU Cracks Down on Greenwashing
📌 The EU introduces legislation requiring brands to prove their sustainability claims or face heavy fines.
🔹 YR2024 – ExxonMobil Sued for Recycling Lies
📌 California sues ExxonMobil, accusing them of knowingly misleading the public about plastic recycling.
🔹 YR2025 & Beyond – The Future of Greenwashing Accountability?
📌 Global brands will face stricter regulations and fines in the billions for misleading sustainability claims. Will it be enough to stop greenwashing?
🚨 THE REALITY CHECK: Only 5% of Plastic is Actually Recycled
📌 Despite all the marketing, 95% of plastic waste still ends up in landfills, oceans, or incinerators. We’re not recycling our way out of this crisis. (Source)
💡 The Takeaway: It’s time for big brands to face bigger consequences for deceptive sustainability claims. Recycling is NOT the solution—reducing plastic production is.
📢 What’s Next? Should governments ban false recycling claims? Should companies pay for end-to-end plastic responsibility? Let’s talk below! 👇

Originally published on LinkedIn on 2025-02-26 16:11:56: https://www.linkedin.com/feed/update/urn%3Ali%3AgroupPost%3A82951-7300548149285117954
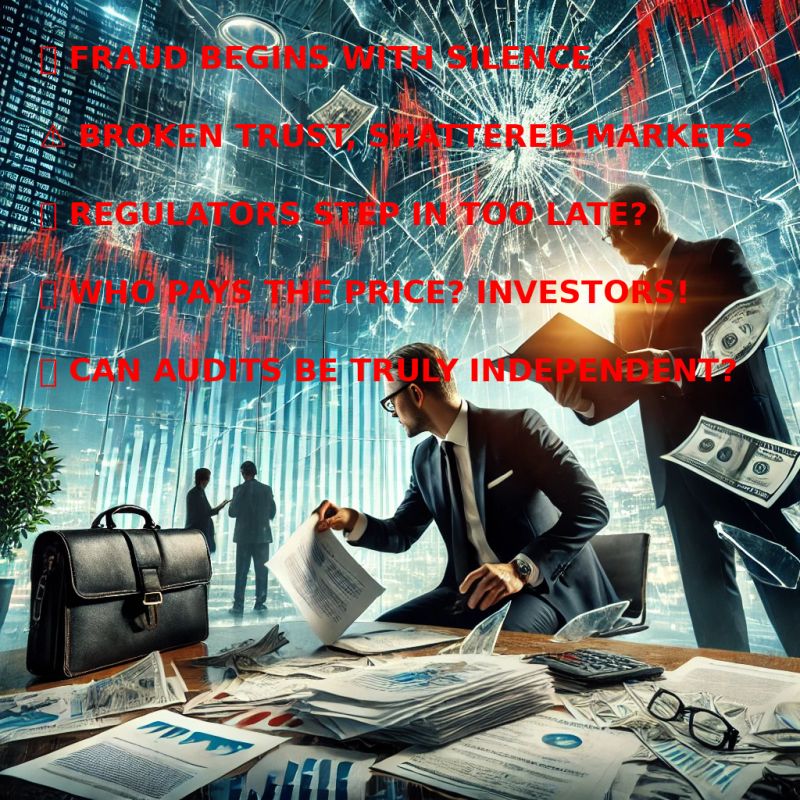
AuditScandal: A Timeline_of_Lies, Exposure & Reckoning
📉 What drives financial fraud?
🚨 Greed. Pressure. Complacency. A broken system.
🔴 When numbers don’t match reality, companies have two choices—fix the problem or hide it.
🔴 When auditors see red_flags, they can raise them or turn a blind_eye.
🔴 When regulators step in, it’s often too_late—the damage is done.
⚖️ Ethics isn’t about policies—it’s about choices.
📉 When businesses trade integrity for short_term gains, they lose more than money. They lose trust.
💰 In Brightcom & CMIL’s case, deception_wasnot_an_accident—it was a choice. And they got caught.
📅 YR2014_2020: The Financial Mirage
🟢 Brightcom Group reports unstoppable growth.
🟢 Profits soar, investors celebrate, and markets trust the story.
🟢 But was it real success—or well-crafted deception?
📅 YR2020_2021: Whispers of Doubt
🔴 SEBI receives multiple complaints.
🔴 Allegations surface:
✅ Profits overstated
✅ Asset manipulation
✅ Non_compliance with accounting norms
📅 YR2021: The First_Strike
🔎 SEBI orders a forensic audit.
🚨 Findings? Brightcom’s numbers don’t add up.
🚨 The illusion starts to crack.
📅 YR2023: The Case Breaks Open
⚠️ SEBI issues a Show_Cause Notice.
⚠️ The findings?
✅ Fabricated profits
✅ Investors misled
✅ Promoters cashing in on inflated shares
📉 Trust? Shattered.
📅 YR2021_2023: The CMIL_Parallel
🔴 Meanwhile, CMIL is also under scrutiny.
📉 Revenue crashes from ₹637 Cr (FY19) to ₹201 Cr (FY21).
📉 Profits turn to ₹194 Cr loss—but auditors stay silent.
📅 2023: NFRA Steps In
🔎 Findings?
❌ No proper audit procedures.
❌ No checks on liabilities.
❌ No questions asked.
📅 YR2024: The Reckoning
💥 Regulators strike hard.
🔴 Brightcom Group Auditors:
✔️ Debarred & fined ₹80 lakh
🔴 CMIL Auditors:
✔️ Debarred & fined ₹60 lakh
🚨 The_Lesson? Prevention is Cheaper Than Punishment.
✅ Boards & IndependentDirectors must challenge audits.
✅ Surprise forensic audits need to become the norm.
✅ Investors deserve real transparency—not smoke & mirrors.
TheBigQuestion: Are We Learning?
🔹 Should auditors face criminal charges for fraud?
🔹 Are regulators too slow in catching corporate misconduct?
🔹 Would AI-driven audits prevent such failures?
🔹 Why aren’t whistleblowers speaking up sooner?
🔹 Is financial transparency still just a checkbox?
🚨 If we don’t fix this now, the next financial scandal is just waiting to happen.
💬 Your thoughts? Is prevention possible—or are we just waiting for the next collapse? 👇

Originally published on LinkedIn on 2025-02-12 07:00:05: https://www.linkedin.com/feed/update/urn%3Ali%3AgroupPost%3A2153908-7295335841441193985
NamasteIndia’s EV Sector: Funding_Dip_Strategic_Realignment?
While recent reports highlight a 37% drop in EV funding, from USD934 million in YR2022 to USD586 million in YR2024, this reflects strategic recalibration rather than a setback. Major investments, infrastructure projects, and corporate contributions are driving sustainable growth.
Key_Insights
1️⃣ Consistent Investment Activity:
Despite the funding dip, the number of deals remained steady at 44, signaling investors focused on high-potential projects.
2️⃣ Top 5 Players Leading the Charge:
Tata Motors: Investing heavily in EV production with plans to launch 10 EV models by 2025, along with Tata Power installing 25,000 chargers by 2025.
Mahindra Electric: Committed over $2 billion toward developing electric SUVs and battery tech by 2026.
Hero Electric: Focused on expanding manufacturing with a target of producing 1 million EVs annually by 2025.
Ola Electric: Scaling operations with a $500 million battery innovation center and production capacity for 10 million EV scooters annually.
BYD India: Plans to invest $1 billion for local production facilities to expand its EV portfolio.
3️⃣ Infrastructure Expansion:
Over 25,000 public charging stations are operational as of 2024, up from 5,000 in 2022.
Projects like Delhi-Mumbai Expressway charging corridors and state-level initiatives (e.g., Karnataka and Tamil Nadu EV clusters) are accelerating progress.
The $1.6 billion EV Infra Boost Plan aims for 100,000 chargers by 2026.
4️⃣ Boost from the PLI Scheme:
The $2.4 billion Production-Linked Incentive (PLI) program for Advanced Chemistry Cell (ACC) batteries is set to create 50 GWh capacity by 2030, enabling domestic battery production and reducing costs.
5️⃣ Market Growth Potential:
EV adoption in India is booming, with 2-wheelers making up 62% of EV sales in 2024.
Overall EV penetration is projected to hit 30% by 2030, driven by fleet electrification and cost reductions.
Conclusion
India’s EV sector is advancing through strategic realignment, with major corporate players, government support, and robust infrastructure development driving progress. This isn’t a decline—it’s the foundation for a sustainable, scalable future.
The road to electrification is accelerating—are you ready to be part of it?
https://lnkd.in/duT26ehp
Download the Times Now app now:
https://lnkd.in/dsbKUgX3
Originally published on LinkedIn on 2024-12-27 02:31:46: https://www.linkedin.com/feed/update/urn%3Ali%3AgroupPost%3A60128-7278236085715914752
Easing_Climate_Anxiety:
Frontier Coalition Invests USD_80M in Carbon Removal Credits 🌍
The Frontier coalition, featuring Google, Stripe, H&M, and Shopify, has taken a bold step toward combating climate change by investing $80M in carbon removal credits. This funding supports startups CO280 and CREW Carbon, driving innovation in carbon removal technologies that generate high-quality carbon credits at premium rates.
🌟 Key Highlights
🔹 CO280: Innovating with cutting-edge technologies like direct air capture and enhanced mineralization for CO2 sequestration.
🔹 CREW&Carbon: Developing groundbreaking solutions in soil sequestration, ocean-based carbon removal, and hybrid approaches.
🔹 Premium_Carbon_Credits: Verified by stringent standards, ensuring transparency, accountability, and measurable climate impact.
🌍 Global Reach
This initiative has the potential to impact countries worldwide:
🌱 Developing Nations:
Likely locations: India, Brazil, Indonesia, and African countries.
Focus: Cost-effective land-based methods like reforestation and soil sequestration.
🏗️ Developed Nations:
Likely locations: USA, Canada, EU, and Australia.
Focus: Advanced technologies that require robust R&D ecosystems.
🌊 Global Oceans:
Enabling ocean-based methods in coastal regions for CO2 capture.
🌎 High_Emission Nations:
Supporting net-zero goals in countries like China, USA, and India.
📅 Timeline of Impact
📌 YR2024–2026:
Pilot projects and early-stage scaling by CO280 and CREW Carbon.
📌 YR2026–2030:
Regional expansion to meet 2030 net-zero goals with scalable technologies.
📌 YR2030–2040:
Full global integration of carbon removal technologies.
Significant contributions to 1.5–2°C climate targets under the Paris Agreement.
🌟 Why It Matters
This investment demonstrates the private sector’s critical role in driving sustainability. By advancing innovative carbon removal solutions, Frontier is enabling countries to meet their climate goals while shaping carbon removal as a key global industry. 🌿
Originally published on LinkedIn on 2024-12-22 13:48:35: https://www.linkedin.com/feed/update/urn%3Ali%3AgroupPost%3A2474261-7276594473118117889
NamasteCarbonPricingIndia:
The_State_of_Carbon_Pricing_2024: Progress, Disparities, and Where India Fits
The YR2024 State and Trends of Carbon Pricing Report highlights both progress and challenges in global carbon pricing as governments strive to meet the Paris Agreement’s goals. With 75 carbon pricing instruments now operational—39 carbon taxes and 36 emissions trading systems (ETSs)—the landscape is evolving, yet significant gaps in pricing levels and emissions coverage remain.
Global Carbon Pricing: The Leaders
Countries exceeding the $80-$100/ton threshold, recommended to limit global warming, are setting the benchmark:
Uruguay: $167/ton – The world leader, powered by its renewable energy dominance.
Switzerland: $132/ton – Among Europe’s most ambitious nations.
Sweden: $127/ton – Achieved a 33% emissions reduction since 1991.
Norway: $108/ton – Balances oil exports with green innovation.
These leaders leverage carbon pricing to fund renewables, incentivize green practices, and drive significant emissions reductions.
Falling_Short: Countries Below $40/ton
Despite the expanding reach of carbon pricing, many nations are still underpricing emissions, limiting their impact:
California (USA): $39/ton – Gradual cap-and-trade implementation.
Japan (Tokyo): $37/ton – Focused on innovation but still below target.
India: $5/ton – A coal cess aimed at balancing affordability and emissions reductions.
Currently, only 23% of global emissions are covered by these instruments, leaving significant gaps in global climate action.
Where India Stands
As the third-largest emitter globally, India represents a critical player in the future of carbon pricing:
$5/ton Carbon Price: Through its coal cess, generating $3 billion annually for renewable energy initiatives.
National Carbon Market: Launched in 2023 to facilitate voluntary carbon trading, with potential for scaling.
500 GW Renewable Energy Target: India is undergoing one of the world’s fastest energy transitions, underscoring its commitment to sustainability.
Carbon Credit Leader: Indian projects dominate voluntary markets, showcasing the country’s capacity to innovate in carbon offsets.
India’s current pricing is modest but represents a foundation for growth. By gradually scaling its carbon price and expanding the carbon market, India can harmonize economic growth with climate goals.
The Way Forward
Carbon pricing is a powerful tool, but the global average remains far below the $80-$100/ton threshold needed to limit warming to 1.5°C. For nations like India, leveraging mechanisms such as renewable energy investments, carbon markets, and circular economy practices can drive impactful change while balancing affordability and growth.
Originally published on LinkedIn on 2024-12-19 20:26:43: https://www.linkedin.com/feed/update/urn%3Ali%3AgroupPost%3A59930-7275607502493278209
Namaste🌞India
Sun Shines Bright on India’s Chemical Industry with Solar Energy
India’s solar energy revolution isn’t just about generating clean energy; it’s also creating a golden opportunity for the chemical industry, which supplies critical materials like polysilicon, silver paste, and encapsulation films. With record-breaking investments, cutting-edge technology partnerships, and government incentives, the chemical sector is positioned to power India’s renewable energy journey.
🏢 Key Industry Players
Tata Chemicals: Focused on high-performance coatings and encapsulation films.
Waaree Energies: Pioneering durable, recyclable solar modules.
Adani Solar: Strengthening in-house chemical production for vertical integration.
Reliance Industries: Partnering with global firms to enter polysilicon manufacturing.
💰 Key Investments in YR2024
🔹 Adani Group: ₹7.5 trillion ($88.53 billion) in Rajasthan, including 100 GW solar projects.
🔹 Tata Power Solar: ₹43 billion invested in a 4.3 GW solar module facility in Tamil Nadu.
🔹 Hero Future Energies: $20 billion to expand renewable capacity to 30 GW by 2030.
🔹 FDI Surge: $3.76 billion in FY 2023-24, a 50% YoY growth in renewable energy.
🤝 Key Technology Partnerships
🔹 Waaree Energies & IIT Bombay: Researching cost-effective perovskite solar cells.
🔹 Reliance Industries & NexWafe (Germany): Developing low-cost polysilicon technologies.
🔹 Tata Chemicals & JohnsonMatthey (UK): Innovating sustainable encapsulation materials.
📍 Geographic & Global Challenges
🔸 Extreme Weather: Heatwaves demand heat-resistant coatings; cyclones call for weatherproof materials.
🔸 Regional Disparities: Solar adoption thrives in western/northern states but lags in the northeast.
🔸 Global Competition:
China dominates polysilicon production.
Southeast Asia offers cost-competitive solar materials.
🔸 Resource Scarcity: Shortages of silver and polysilicon create supply chain challenges.
🔸 Sustainability Demands: Global buyers require eco-friendly and low-carbon solar panels.
🚀 Opportunities for India’s Chemical Industry
🔹 Scale domestic manufacturing of critical materials.
🔹 Develop climate-resilient coatings tailored for diverse Indian geographies.
🔹 Leverage green technology partnerships for innovation.
🔹 Expand into underdeveloped regions with decentralized solar projects.
🌍 Conclusion
The Indian chemical industry has a pivotal role in powering the solar energy boom. By addressing global challenges, leveraging investments, and fostering innovation, it can solidify its position as a global leader in solar-related chemical manufacturing.

Originally published on LinkedIn on 2024-12-13 18:37:46: https://www.linkedin.com/feed/update/urn%3Ali%3AgroupPost%3A3880479-7273405759328038912
NamasteShiningIndia YR2024:
Milestone Year for Solar Investments in India
India’s solar energy journey reached new heights in 2024, with record-breaking investments and landmark collaborations paving the way for a cleaner, greener future. Here are the highlights:
🌞 Tata Power: Announced a ₹1.2 trillion ($14.32 billion) investment over the next decade to develop 10 GW of renewable energy capacity in Rajasthan.
🌞 Adani Green Energy: Secured a 25-year bid to supply Maharashtra with 6,600 MW of power, including 5,000 MW of solar energy from its Khavda, Gujarat park.
🌞 Jakson Green: Closing in on a $476 million fundraise to expand its capacity by 1 GW by 2026.
🌞 State_Level Initiatives: Rajasthan hosted the Rising Rajasthan Investment Summit 2024, attracting Saudi Arabian investments in solar and wind energy.
🌞 Global Collaborations: Technology giants like Keppel Ltd. partnered with Tata Power and JBM Group to advance India’s energy transition with innovative solutions in e-mobility and smart energy systems.
India’s Solar Potential is Shining Bright
With over 300 sunny days annually, India reached 92.1 GW of solar capacity by October 2024, contributing 59% of its renewable energy portfolio. The ambitious target? 500 GW of renewable energy capacity by 2030.
Challenges Under the Sun
Despite the progress, India faces obstacles:
🔸 Land Conflicts: Solar farms require extensive land, often leading to disputes.
🔸 Storage Gaps: Intermittent solar energy needs robust storage solutions.
🔸 Import Dependency: Heavy reliance on imported solar panels poses risks.
🔸 Financial Strain: State electricity boards often delay payments to producers.
🔸 Sustainability Concerns: Recycling end-of-life solar panels remains a challenge.
Innovations Lighting the Way Forward
The solar sector is embracing exciting advancements:
✅ Floating Solar Farms: Utilizing reservoirs like Kerala’s Banasura Sagar.
✅ Agri-Photovoltaics: Integrating farming with solar energy generation.
✅ Hybrid Systems: Combining solar with wind or hydro for consistent power.
The Road Ahead
India is on the brink of a solar revolution, with 2024 marking a turning point. Unprecedented investments, robust policies, and innovative technologies are setting the stage for India to lead the global renewable energy movement.
☀️ The question is: Will India rise to the occasion and cement its place as a solar energy superpower?

Originally published on LinkedIn on 2024-12-13 18:13:24: https://www.linkedin.com/feed/update/urn%3Ali%3AgroupPost%3A2474261-7273399624835432448
NamasteInvestIndia: Turning Challenges into Champions of Growth!
InvestIndia, the country’s premier investment promotion agency, has emerged as a symbol of resilience and transformation, especially in the face of global uncertainties in YR2023 and YR2024. Through bold strategies, innovative leadership, and a focus on sustainability, Invest India not only rebounded strongly but also positioned the nation as a global investment powerhouse.
1. Foreign Direct Investment (FDI):
Despite global headwinds, Invest India achieved an impressive rebound, securing a 22% weighting in the MSCI Emerging Markets Index, surpassing China’s 19%, signaling renewed global confidence in India’s market.
2. Ease of Doing Business:
Reforms were accelerated, reducing 41,000 compliances, decriminalizing 3,600 laws, and facilitating 255,000 approvals through the National Single Window System, making it easier than ever to do business in India.
3. Infrastructure Development:
With the ambitious PM GatiShakti Plan, the agency drove projects worth $743 billion, integrating 35 logistics systems to enhance connectivity, efficiency, and supply chain resilience.
4. Startup Ecosystem:
Scaling up significantly, Invest India recognized 114,000 startups, created 1.2 million jobs, and secured $2.08 billion in funding for 915 startups, showcasing adaptability and innovation amid economic challenges.
5. Production-Linked Incentive (PLI) Scheme:
Attracted $17 billion in investments, producing $131.6 billion in output, and creating nearly 1 million jobs, ensuring stability in manufacturing and boosting industrial growth.
6. Renewable Energy:
Leading in sustainability, Invest India set ambitious 500 GW by 2030 targets and drove $385 billion in green investments, making India a global leader in renewable energy during critical times of climate urgency.
Conclusion
The remarkable resilience of Invest India in 2023 and 2024 exemplifies the power of focused leadership and bold decision-making in uncertain times. While Phase 1 laid the groundwork during a period of stability, Phase 2 turned challenges into opportunities, fostering innovation, sustainability, and global competitiveness.
As India strides toward becoming a self-reliant, globally dominant economic powerhouse, Invest India stands as a testament to the nation’s ability to adapt and thrive. Together, these transformative years highlight a journey of resilience, innovation, and enduring progress, setting the stage for India’s growth in the next decade.
Originally published on LinkedIn on 2024-12-05 12:23:32: https://www.linkedin.com/feed/update/urn%3Ali%3Ashare%3A7270412478365265921

