Silicon Took the Stage. War Moved the Routes.
Fluorine Holds the System Within Tolerance.
Dr. Anju Sharma | KtalystInsights | KtalystKlues
Last month wasn’t a tech shift.
It was a materials constraint revealing itself.
War stretched routes.
Routes stressed supply.
Supply exposed what cannot fail.
Fluorine chemistry.
Not a commodity.
A performance enabler.
From PVDF in batteries to LiPF₆ electrolytes, from PTFE stability layers to NF₃ in chip etching
These molecules don’t just participate.
They define precision, stability, and thermal tolerance.
⚙️ The 5Ts — What Actually Shifted
1️⃣ Precision Lock-in
Fluoropolymers & salts → no substitutes at scale
2️⃣ Route Fragility
Red Sea disruption → +10–15 days delays
Logistics now part of chemistry
3️⃣ Regulatory Gatekeeping
PFAS tightening (EU/US) → compliance = market access
4️⃣ Demand Collision
EVs (~17M), AI compute, semiconductors
→ competing for the same molecules
5️⃣ License Volatility
~$55–90B PFAS liability shadow
→ trust now priced into business models
🔄 The 5Es — System Impact
⚙️ Efficiency
↑ molecular performance → ↓ system resilience
💰 Economics
High-margin molecules → offset by $2–4M/voyage logistics premiums
🚀 Execution
Nanometer precision → zero tolerance for disruption
🌐 Ecosystem
Concentrated supply → deeply interdependent networks
⚡ Energy
Battery, chip, cooling systems → all fluorine-dependent
🌍 The 5Ps — Where Power Now Sits
👥 People (Capability)
US, Japan → advanced chemistry + precision engineering
💰 Profit (Value Capture)
Few control the chain (Chemours, Daikin, Arkema, AGC)
→ Value is not created here. It is controlled.
🌍 Planet (Regulation)
EU → defining PFAS boundaries
→ Regulation is now exclusion.
📜 Policy (Geopolitics)
Trade routes + compliance → new supply security
🏛️ Power (Positioning)
🇨🇳 China → ~61% PVDF scale dominance
🇰🇷 Korea → ~$1.7B materials integration
🇺🇸 US → IP + advanced chemistries
🇯🇵 Japan → semiconductor precision backbone
🇪🇺 EU → regulatory control
🇮🇳 India → ~$770M+ entry bets (materials + IFC)
The Real Stack of PaxSilica
Not a stack.
A dependency ladder.
Silicon defines function.
Fluorine enables performance.
Logistics decides continuity.
💡 Dr. Anju Insight
Demand didn’t change.
Tolerance did.
The system can no longer absorb disruption.
Stable chemistry. Fragile systems.
So the real question is:
Are you scaling demand…
or de-risking dependency?
Dr. Anju Sharma
KtalystInsights KtalystKlues PaxSilica Fluorochemicals Semiconductors KtalystGreenLove Ktalyst5Ps5Es
Originally published on LinkedIn on 2026-03-22 14:48:55: https://www.linkedin.com/feed/update/urn%3Ali%3Ashare%3A7441496135136907265
When_Will_EV_Go_Actually_Green?
Dr. Anju Sharma | KtalystInsights™
Zero tailpipe ≠ Zero carbon. Boards know it. Gen-Z can smell it.
The EV conversation has entered its grown-up phase.
The question is no longer “Is it electric?
It is “Show me the lifecycle math.
1) The headline data (why this matters now)
✓ By 2030, full-lifecycle EV emissions vs ICE fall by:
✓ EU: ~74–77% lower
✓ US: ~62–76% lower
✓ China: ~48–64% lower
✓ India: ~30–56% lower
Hook: The car didn’t change. The grid did.
2) Where the carbon actually sits
✓ Battery manufacturing today emits 60–100 kg CO₂e per kWh
✓ A 60 kWh battery starts life with 3.6–6.0 tonnes CO₂e
✓ Factory electricity source can swing emissions by 3×
Translation:
If Scope-2 is dirty, the EV is just quietly carbon-loaded.
3) Countries winning the EV reality game
✓ Norway: ~96% of new car sales are electric
✓ China: ~48% of passenger car sales already electric
✓ EU: ~17–20% EV share with 2035 ICE exit locked
✓NamasteIndia: 30% EV target by 2030, fastest growth in 2W & 3W
Pattern: Adoption follows grid clarity + policy certainty, not slogans.
4) Companies that actually decide the footprint
✓ BYD: ~2.2M+ BEVs sold; LFP chemistry lowers material risk
✓ Tesla: ~1.6M deliveries; efficiency and software edge
✓ CATL: ~38% global battery install share
Reality: Battery supply chains decide EV greenness more than car badges.
5) What truly changes in 2026–2030
✓ Grid policy becomes EV policy
✓ Cleaner power automatically lowers CO₂ per km
✓ Batteries move from marketing to math
✓ Carbon footprint disclosure, recycled-content mandates, battery passports
✓ Recycling becomes a supply chain
✓ >90% metal recovery technically achievable
✓ Recycled content stabilises cost and ESG credibility
✓ Manufacturing decarbonises or loses access
✓ Grey batteries get priced out by carbon and trade rules
6) Is this a war on crude-rich or climate action?
✓ It’s structural, not emotional
✓ Net oil importers use EVs for energy security
✓ The US treats EVs as an industrial race plus grid economics
Old world ran on barrels.
New world runs on electrons, minerals, and megawatts”. Dr. Anju Sharma
KtalystKlues™
EVs don’t go green when engines disappear.
They go green when battery, grid, and recycling become one auditable system.
KtalystInsights
EVs are now economic infrastructure: lifecycle-clean supply chains drive growth, while greenwashing triggers penalties, capital flight, and lost credibility.
EV EnergyTransition BatteryEconomics GridDecarbonization CircularEconomy Scope2 Scope3 KtalystInsights DrAnjuSharma DataComa
Originally published on LinkedIn on 2026-01-04 05:00:23: https://www.linkedin.com/feed/update/urn%3Ali%3AgroupPost%3A82093-7413444160403283969
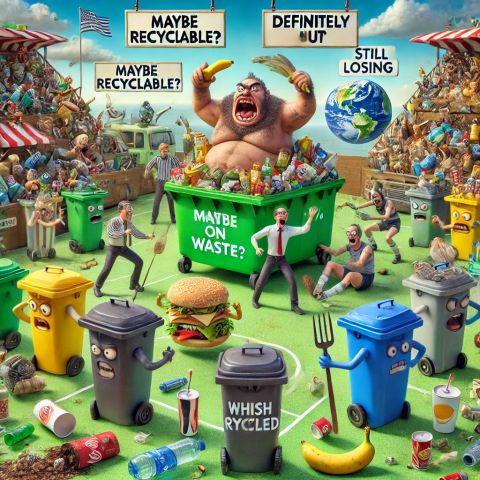
♻️ “The_War_on_Waste: Who’s Leading & Who’s Losing?” 🌍🚨
Governments ban plastics, promote recycling, and push circular economies, but is waste truly being reduced or just shifting elsewhere? Here’s the country-wise reality based on hard data.
🌎 Plastic_Waste: The Biggest Polluters
✅ Top Plastic Waste Generators (Million Tons Annually):
🇺🇸 USA – 42M tons (World Bank, 2023)
🇨🇳 China – 21M tons (Statista, 2024)
🇮🇳 India – 10M tons (CPCB, 2024)
🚨 Reality Check: 94 countries banned plastics, but only 9% is actually recycled. (UNEP, 2024)
🏆 Winners: 🇪🇺 EU Nations (strict bans & recycling laws)
❌ Losers: 🇺🇸 🇮🇳 🇨🇳 (high waste, low recycling rates)
👗 Fast_Fashion & E_Waste: The Hidden Trash Crisis
✅ Top Fast Fashion Waste Producers:
🇨🇳 China – 26M tons annually (Greenpeace, 2024)
🇺🇸 USA – 11.3M tons landfilled yearly (EPA, 2023)
🇪🇺 EU – 5.8M tons discarded (EU Commission, 2024)
🚨 Reality Check: Only 17% of global e-waste is properly recycled.
🏆 Winners: 🇯🇵 🇩🇪 🇰🇷 (advanced e-waste policies)
❌ Losers: 🇺🇸 🇮🇳 🇨🇳 (high waste, poor recycling infrastructure)
♻️ Recycling: Who’s Actually Doing It?
✅ Top Recycling Countries (% Recycled Waste):
🇩🇪 Germany – 67% (Highest global rate, Statista, 2024)
🇰🇷 South Korea – 59% (Strict sorting laws)
🇸🇪 Sweden – *50% recycling + 50% waste-to-energy
🚨 Worst Recycling Rates:
🇮🇳 India – 30% recycling rate (CPCB, 2024)
🇺🇸 USA – 32%, most plastic exported (EPA, 2023)
🇨🇳 China – 28% (Statista, 2024)
🏆 Winners: 🇩🇪 🇰🇷 🇸🇪 (high recycling & circular economy initiatives)
❌ Losers: 🇺🇸 🇮🇳 🇨🇳 (high waste, low recycling rates)
🌍 Circular Economy: Real Shift or Just Talk?
✅ EU Circular Economy Package: 65% recycling target by 2035 (EU Commission, 2024)
✅ China’s ‘Zero Waste Cities’: Pilot in 16 cities to cut landfill waste (China’s Environment Ministry, 2024)
✅ India’s EPR Policy: Firms must recover plastic waste they produce (CPCB, 2024)
🚨 Reality Check: Less than 10% of companies comply with waste responsibility laws. (Greenpeace, 2023)
🏆 Winners: 🇪🇺 EU Nations, 🇨🇳 China (pushing policy enforcement)
❌ Losers: 🇺🇸 USA (low producer responsibility laws)
🏆 KeyTakeaway
The War on Waste isn’t just about bans—it’s about holding corporations accountable, enforcing policies, and cutting overproduction.
🌍 Some nations lead, others drown in trash. Where does your country stand?
👉 Are we winning or just moving waste elsewhere?
WasteCrisis CircularEconomy PlasticPollution RecyclingMyths Sustainability NetZero


Originally published on LinkedIn on 2025-01-31 03:03:19: https://www.linkedin.com/feed/update/urn%3Ali%3AgroupPost%3A131340-7290927601190100992
The Art of War in Corporate Life
Applying Sun Tzu’s “The Art of War” to the corporate battlefield involves strategic thinking, calculated actions, and understanding the dynamics of competition. Here’s how the wisdom translates:
1. Know Yourself and Know Your Enemy
Corporate Parallel: Understand your strengths, weaknesses, and organizational goals while analyzing competitors, market trends, and internal challenges.
Action: Conduct SWOT analyses, stay informed about industry shifts, and anticipate competitors’ moves

Originally published on LinkedIn on 2024-12-14 18:08:34: https://www.linkedin.com/feed/update/urn%3Ali%3AgroupPost%3A13927028-7273760799142129664
Fighting Nature and winning the battle… what will happen when We lose the War
Despairing for Disappearing Hills in NaviMumbai
For fourteen years, my flat balcony has been my special place—a spot where I could relax and enjoy the lush green leaves against the backdrop of rolling hills. But now, as usual the concrete is taking up this serene area into high-rise buildings.
This change threatens to take away my calming view, which has been my friend for so long. Along with it another natural habitat will die due to greedy hunger of Development. These hills are gradually being surrounded by towering structures, and it feels like nature is losing to human development.
The clash of Titans urbanization and nature happens silently but significantly. Rules favoring development often overpower our connection to the natural world. We stand helpless once again!!! No new governments help in this age old destruction 😔

Originally published on LinkedIn on 2024-08-23 15:12:17: https://www.linkedin.com/feed/update/urn%3Ali%3Ashare%3A7232766605183586304

