🔋🚗 KtalystInsights | GreenTrendsMobility
SmartCities | BatteryTech | MobilityReimagined | MadamSustainability
> “If mobility is freedom, then my carbon footprint better be wearing green shoes!
AnjuSharma, KtalystKeystone 👣🌱
HotspotsDriving_the_Next_Mobili_Wave
🔵 🇩🇪 Germany & 🇯🇵 Japan
→ Digital Twins & Vehicle Simulation
Audi, Bosch, and Toyota are using full-stack mobility twins for crash tests, emissions planning, and ADAS validation.
Japan’s Yokohama Mobility Expo 2025 revealed live vehicle twin dashboards syncing with edge clouds.
🧠 VirtualValidation | MobilityOS
🔴 🇺🇸 UnitedStates
→ AI + Cybersecure Mobility Systems
Tesla and Waymo lead in AI-powered adaptive navigation.
DARPA-backed R&D on vehicle OS-level firewalls and OTA security protocols is shaping ISO 21434 compliance.
🔐 AutoCyberSecurity | AIonWheels
🟢 🇮🇳 NamasteIndia
🔋 Battery_and_Electrification
IITDelhi, IITBHU, and IITMadras developing:
▪ Solid-state & sodium-ion batteries
▪ Tropical-climate EV packs
▪ Battery passports & diagnostics
▪ Advanced BMS systems
🌱 GreenHydrogen & FuelCells
IITMadras + Hyundai: Hydrogen CoE with indigenized electrolysers
IITDelhi: SOEC-based green hydrogen under CSR-supported R&D
🚄 Hyperloop & VTOL Mobility
IITMadras: TuTrHyperloop enters global test partnerships
VTOL concepts in collaboration with Indian Railways for urban air mobility
⚙️ Rare_Earth_Free_EV_Motors
IITBhubaneswar developing cost-effective, import-light EV motor tech
🏙️ SmartMaterials & Infra
IITDelhi leading innovation in:
▪ 3D-printed smart fabrics
▪ Lightweight green mobility materials
🤝 Industry-Academia Power Collabs
Hyundai, TVS, Tata, SYSTRA funding & scaling IIT R&D
Solid-state + sodium-ion batteries getting Make-in-India momentum via CSIR & Amara Raja.
India’s 2025 Battery Summit backed EV battery passport pilots and lithium-sulfur prototype deployment.
⚡ SustainableStorage | BatteryToBoardroom
🟣 🇨🇳 China
→ V2X Infrastructure + Hydrogen Mobility
Smart roads in Shenzhen and Shanghai are embedded with V2X sensors and integrated with real-time traffic AI.
Sinopec, BYD advancing H₂ fuel cell trucks and urban hydrogen refueling hubs.
🌱 GreenFreight | ConnectedMobility
🟠 🇮🇹 Italy & 🇫🇷 France
→ Smart Urban Mobility Pilots
Milan & Paris deploying AI parking, curb management, and blockchain-based EV charge credits.
Startups like Mobena are testing interoperable MaaS platforms for dense metro zones.
🚦 SmartParking | MobilityAsAService
🟡 🌏 ASEAN – Singapore, Thailand, Vietnam→ Mobility-as-a-Service + Clean Buses
Singapore leads integrated transport wallets & AI-driven bus routing.
Vietnam’s VinFast is trialing regional EV buses and low-cost battery swaps.
📍KtalystQuery
Which of these innovations will reshape your country?
🚦 AI-powered signals
🚚 Hydrogen-powered trucks
📍 Smartcurbside algorithms
Originally published on LinkedIn on 2025-07-09 05:02:05: https://www.linkedin.com/feed/update/urn%3Ali%3AgroupPost%3A131340-7348577161101873152
Sunburn or SunBoom?
U.S. Slaps 3,521% Tariffs on Solar Imports — The SolarSector Feels the Heat (and Opportunity)
When the sun shines too bright on unfair play, tariffs bring the shade.” — KtalystInsight
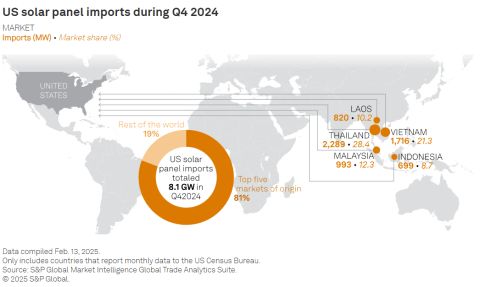
The UnitedStates has swung a solar sledgehammer — imposing tariffs as high as 3,521% on solar panel imports from Cambodia, Vietnam, Thailand, and Malaysia.
This stems from a Department of Commerce finding that Chinese companies were rerouting solar products through Southeast Asia to dodge existing duties.
Winners Emerging:
FirstSolar, Qcells, and other U.S. manufacturers celebrating a MadeInAmerica solar boom.
SolarBank CEO Dr. Richard Lu shared a sharp pivot — expanding domestic community solar and energy storage solutions, especially to feed the AI-driven data center boom.
SolarBank’s new 2.9 MW Gainesville, New York project is already under development.
Losers Worried:
Renewable project developers predict a 20–30% rise in project costs.
Supply chains could see 6–12 months delays, impacting Biden’s climate goals.
Global Echoes: Solar Under Trade Siege
EuropeanUnion’s CBAM (Carbon Border Adjustment Mechanism):
Though solar isn’t covered yet, solar supply chains are preparing for impact.
CBAM rollout from 2026 may push solar module prices up by ~10% if embedded carbon costs get added.
Manufacturers are already shifting wafer and polysilicon production to cleaner-energy countries like Canada and Brazil to avoid CBAM penalties.
India’s Solar Firewall:
Imposed 40% Basic Customs Duty on solar modules from April 2022 to promote Atmanirbhar Bharat.
Indian players like Adani Solar and Tata Power Solar are scaling local module capacity aggressively.
Canada’s Quiet Defense:
Continuing antidumping duties on Chinese modules, aiming to build a resilient domestic clean energy base.
Money Moves: Follow the Smart Investors
Brookfield Renewable Partners and BlackRock are pivoting funds into localized solar manufacturing and battery storage ecosystems.
NextEra Energy eyes major gains by scaling U.S.-based clean energy supply chains.
Ktalyst Perspective:
This tariff wave, plus the CBAM ripple effect, isn’t protectionism — it’s market redesign by climate necessity.
The winners will be solar companies that decarbonize supply chains, invest in local resilience, and pivot toward clean manufacturing clusters in NorthAmerica and India.

Originally published on LinkedIn on 2025-04-26 18:06:28: https://www.linkedin.com/feed/update/urn%3Ali%3AgroupPost%3A2153908-7321957853764677632
KnowledgeKtalyst GreenerDrainage | Bioswales Without Borders: How the World Channels Change
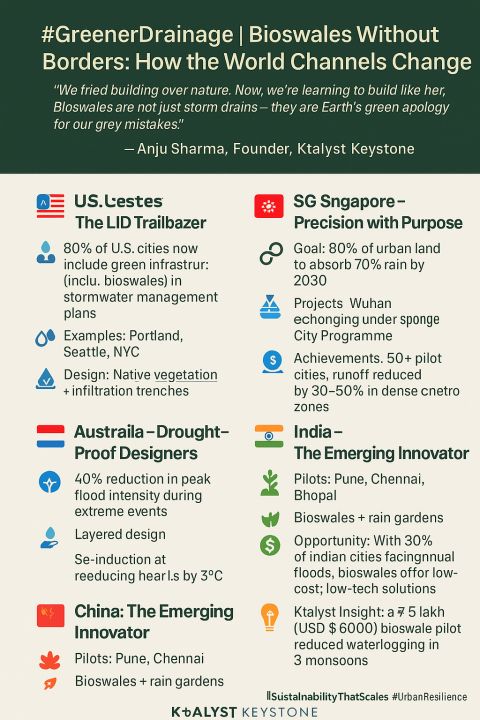
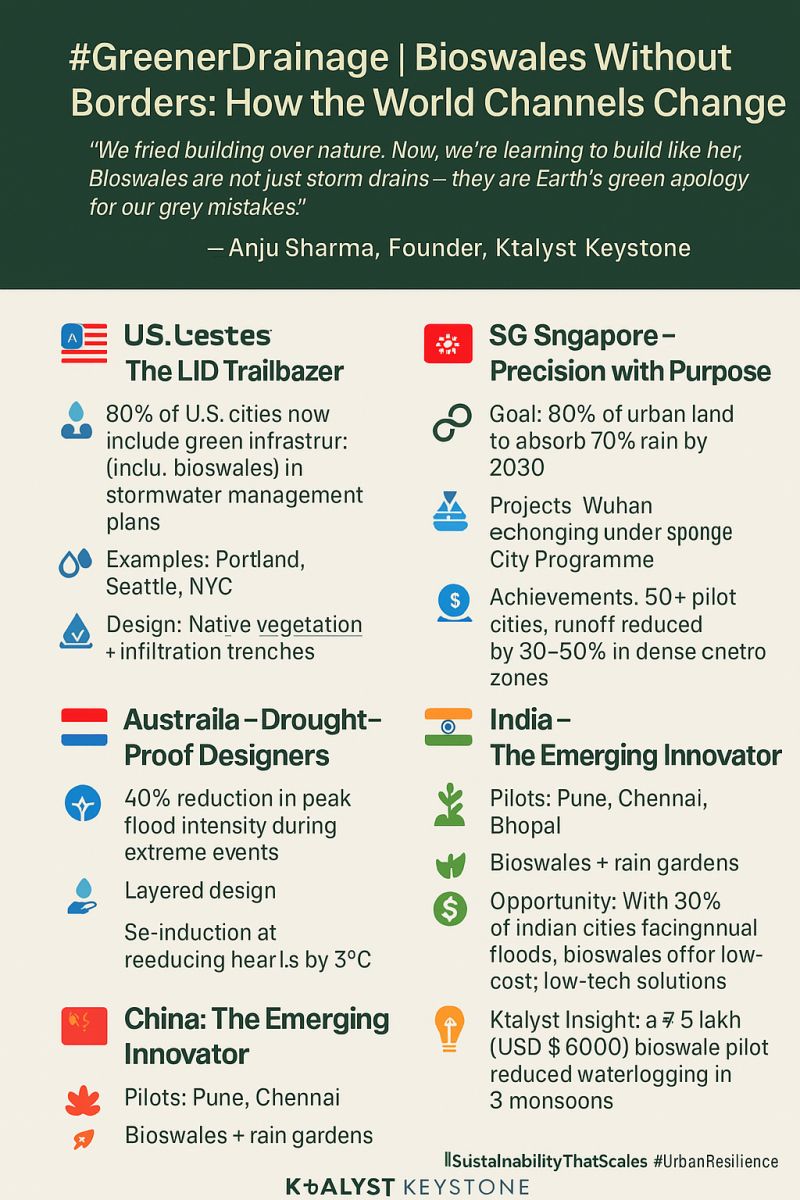
We tried building over nature. Now, we’re learning to build like her. Bioswales are not just storm drains – they are Earth’s green apology for our grey mistakes.
Anju Sharma | Founder, Ktalyst Keystone
What if stormwater could clean itself before reaching our rivers?
Around the world, bioswales are turning this idea into a reality—naturally filtering water, reducing floods, and beautifying cities while addressing climate resilience.
🌍 Six Countries. Six Styles. One Green Purpose.
🇺🇸 UnitedStates – The LID Trailblazer
🌧️ 80% of U.S. cities now include green infrastructure (incl. bioswales) in stormwater management plans.
🏙️ Examples: Portland, Seattle, NYC
🌿 Design: Native vegetation + infiltration trenches
⚡ Outcome: Up to 90% runoff volume reduction in key pilot zones
🇩🇪🇳🇱 Germany & Netherlands – Bicycle Bioretentionists
🚲 65% of urban roads in Dutch cities use SuDS layouts
🌼 Famous For: Stormwater swales alongside bike highways
📸 Bonus: Used for placemaking and urban branding
🇦🇺 Australia – Drought_Proof Designers
☀️ 40% reduction in peak flood intensity during extreme events (source: Melbourne WSUD case study)
🦘 Cities: Melbourne, Brisbane
🌳 Layered Design: For dry spells and cloudbursts
🔥 Impact: Bioswales integrated into parks, reducing heat islands by 3–5°C
🇸🇬 Singapore – Precision_with_Purpose
💧 ABC Waters Programme launched in 2006
🏝️ Projects: Bishan-AMK Park, Punggol Waterway
🌿 Result: Cleaner waterways + real estate uplift near bioswale zones (up to 12% premium)
🪷 Quote from PUB: “Every drain is now a destination.
🇨🇳 China – The UrbanSponge Model
🏙️ Goal: 80% of urban land to absorb 70% of rain by 2030
🌾 Projects: Wuhan, Chongqing under Sponge City Programme
📉 Achievements: 50+ pilot cities, runoff reduced by 30–50% in dense metro zones
🇮🇳 India – The EmergingInnovator
🇮🇳 Pilots: Pune, Chennai, Bhopal
🌱 Design: Bioswales + rain gardens
💡 Opportunity: With 30% of Indian cities facing annual floods, bioswales offer low-cost, low-tech solutions
🌟 Ktalyst Insight: A ₹5 lakh (USD ~$6,000) bioswale pilot reduced waterlogging in 3 monsoons


Originally published on LinkedIn on 2025-04-09 06:51:09: https://www.linkedin.com/feed/update/urn%3Ali%3AgroupPost%3A82951-7315627313553981440
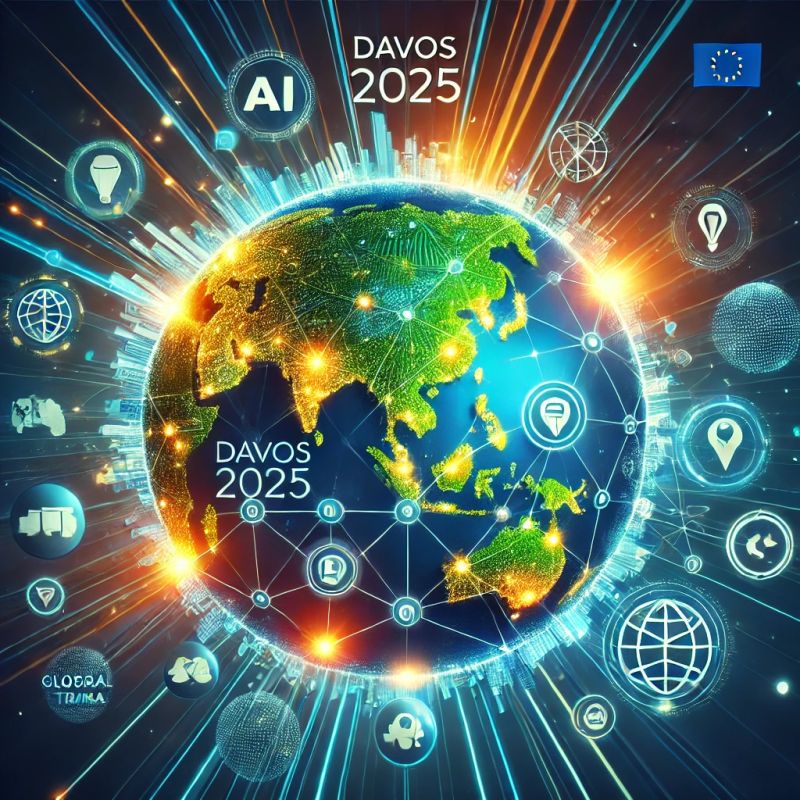
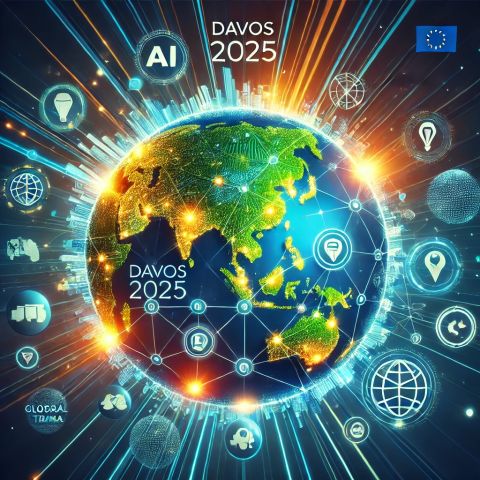
🌍NamasteIndia among the Davos2025: A $1.5 Trillion+ Commitment to Redefine the Future! 🌟
The WorldEconomicForum has set the stage for globaltransformation, with groundbreaking investments targeting Sustainability, Innovation, and EconomicRecovery. Here’s how key players are shaping the next decade:
#🇺🇸 UnitedStates – #$790Billion
🖥️ Microsoft: #$200B for AIinfrastructure (by 2030).
🚗 Tesla: #$50B for EV and batterytech (by 2028).
🌱 BlackRock: #$25B for RenewableEnergy (by 2035).
💊 Pfizer: #$15B for biotechR&D (by 2027).
#🇪🇺 EuropeanUnion – #€45Billion (#$49B)
☀️ Repsol & SaudiAramco: #€1.5B in GreenEnergy (2025–2028).
🚙 Volkswagen: EV investments worth #€10B (by 2030).
💧 TotalEnergies: #€5B for GreenHydrogen (2025–2030).
#🇮🇳 India – #₹6.3Trillion (#$76B)
🔋 JSWGroup: #₹3T (#$34.67B) for EVs and Renewables (2025–2030).
🏭 ArcelorMittal/NipponSteel: #₹1.4T (#$17B) for SteelProduction (by 2030).
☁️ AWS: Data centers worth #₹60,000crore (#$7.4B) (by 2035).
⚡ SunPetrochemicals: #₹45,000crore (#$5.5B) for Hydropower and solar (2025–2030).
#🇨🇳 China – #$165Billion
🚘 BYD: EV and batterytech investments worth #$20B (by 2028).
🌆 Huawei: #$15B in SmartCities and 5G (by 2030).
💨 CNPC: #$10B for GreenHydrogen (2025–2030).
#🇯🇵 Japan – #$37Billion
🚙 Toyota: Hydrogen-poweredvehicles worth #$10B (2025–2030).
🖥️ Sony: QuantumComputing and AI worth #$5B (by 2028).
#🌍 OtherHighlights
🌱 SouthAmerica: #$1.5B for AmazonRainforest conservation.
⚡ MiddleEast: #$2B for NEOM’s renewableenergy.
💻 Africa: #$10B for DigitalTransformation and greenprojects.
🚀 GlobalImpact | SustainabilityGoals | InnovationDriven
With investments spanning 2025–2035, these commitments are set to reshapeindustries and drive sustainablegrowth worldwide.
What are your thoughts on this globalshift toward SustainableDevelopment? Let’s discuss! 💬
Originally published on LinkedIn on 2025-01-23 12:45:20: https://www.linkedin.com/feed/update/urn%3Ali%3AgroupPost%3A3046562-7288174968993976320
🌟 GlobalVoices at Davos2025: Key Day 1 Highlights
🇺🇸 UnitedStates: Focused on AIInnovation, TradePolicy shifts, and balancing growth with Regulation.
🇮🇳 India: Showcased GreenEnergy leadership and AffordableAI for global equity.
🇪🇺 EuropeanUnion: Advocated for AIGovernance and reaffirmed NetZero commitments.
🇨🇳 China: Highlighted GreenTech advancements and multilateral EconomicRecovery.
🇯🇵 Japan: Announced HydrogenTechnology investments and championed ResponsibleAI.
🌍 Africa: Pushed for ClimateFinancing and access to DigitalTransformation.
🇧🇷 Brazil: Demanded stricter AmazonProtection and increased ClimateAid.
🇬🇧 UnitedKingdom: Focused on EthicalAI and boosting RenewableEnergy.
🇦🇺 Australia: Emphasized ClimateResilience and AIDriven solutions.
📊 Key Statistics from Davos2025
Billionaires’ wealth grew 3x faster in 2024 than the global average, spotlighting widening EconomicInequality.
Protests highlighted the influence of concentrated wealth and power, including concerns over figures like Donald Trump and Elon Musk.
Geopolitical shifts dominated discussions, with the inauguration of the 47th U.S. President shaping global trade dialogues.
KeyTakeaways: United on AI, Sustainability, and GlobalCollaboration for a better future.
WEF Leadership Innovation
Originally published on LinkedIn on 2025-01-20 12:51:20: https://www.linkedin.com/feed/update/urn%3Ali%3AugcPost%3A7287089315162058752
NamasteElectricIndia
Nickel: The Metal Powering the Global Energy Transition
🔋 Nickel Reserves Worldwide:
Global nickel reserves are estimated at 95 million metric tons (USGS, 2023). Key reserves include:
Indonesia: ~22 million tons (largest reserve).
Australia: ~21 million tons (rich in high-grade nickel).
Brazil: ~16 million tons.
Russia: ~7 million tons.
Philippines: ~5 million tons.
🔋 India:
Growing EV & renewable energy demand.
Limited domestic reserves; heavily reliant on imports.
Focus: Recycling & international sourcing.
🌏 China:
Largest nickel consumer; dependent on Indonesian imports.
Demand for EV batteries projected to rise from 93 kt (2023) to 379 kt (2040).
🇺🇸 UnitedStates:
Relatively small nickel reserves (~300,000 tons).
Imports dominate; nickel demand for renewables projected to grow from 81 kt (2020) to 987 kt (2040).
🇪🇺 European Union:
Minimal reserves; relies heavily on imports.
EV storage demand could reach 3,352 kt (2040).
Initiative: Battery recycling under the European Battery Alliance.
Global Challenge: Balancing supply with demand through sustainable mining, recycling, and innovation is critical to achieving a green energy future.

Originally published on LinkedIn on 2025-01-09 12:20:12: https://www.linkedin.com/feed/update/urn%3Ali%3AgroupPost%3A3880479-7283095213785427968
What_Happened_in_Busan: A Turning Point for Global Plastic Pollution
🚨 The INC5 negotiations in Busan, South Korea, brought together over 190 countries to discuss the first-ever legally binding treaty on plastic pollution. Here’s what stood out:
🌍 Key Outcomes
Lifecycle Approach: Agreement to address plastic pollution across its 400 million tonnes/year lifecycle, from production to disposal.
Urgent Action: Only 9% of 7 billion tonnes of plastic waste ever produced has been recycled.
Focus on Upstream Solutions: Talks on banning single-use plastics and hazardous chemicals, which make up 50% of marine litter globally.
Equity in Action: Developing nations emphasized support, with 79% of plastic waste ending up in landfills or the environment—disproportionately impacting them.
Participation: A collaborative forum with NGOs, policymakers, and industries driving diverse solutions.
🚧 Challenges
Upstream vs. Downstream Divide: Conflicting priorities as only 20% of countries supported upstream prevention efforts.
Global North_South Divide: Developed nations export 10 million tonnes/year of plastic waste, burdening the developing world.
Funding Gaps: Insufficient pledges to meet the estimated $10 billion/year required for effective waste management.
Implementation Clarity: No unified plan for monitoring the 29 million tonnes of plastic entering oceans annually.
📊 Regional Snapshots
1️⃣ India:
Generates 9.3 million tonnes/year, the highest globally.
60% recycled, mostly informally. Single-use plastics still account for 43% of waste.
2️⃣ China:
Produces 2.8 million tonnes/year.
2017 import ban on plastic waste reshaped global waste management.
3️⃣ SouthKorea:
Claims 73% recycling, but true recycling is only 27%.
Rising plastic waste due to packaging demand.
4️⃣ UnitedStates:
4.5% recycling rate, far below the global average (15%).
Shifted stance to support plastic production reduction globally.
5️⃣ EuropeanUnion:
Aims for all packaging to be recyclable or reusable by 2030 under the European Plastics Strategy.
Leads in recycling rates, contributing significantly to global efforts
🌟 The Path Forward
The world must bridge divides and adopt a holistic lifecycle approach to achieve a plastic-free future. INC5 is the beginning, not the end.
Source / shared link: https://www.unep.org/inc-plastic-pollution/session-5
Originally published on LinkedIn on 2025-01-07 03:25:12: https://www.linkedin.com/feed/update/urn%3Ali%3AgroupPost%3A3880479-7282235800119881729
🌞 Solar Energy: Powering NamasteIndia’s Renewable Revolution at the Most Competitive Costs 🌞
🌍 Solar Energy Prices: A Global Perspective
China 🇨🇳
Installed Capacity: ~609,921 MW
Utility-Scale Solar Cost: As low as $0.10 per watt
UnitedStates 🇺🇸
Installed Capacity: ~139,205 MW
Utility-Scale Solar Cost: Some projects report costs as low as $0.016 per kWh
Japan 🇯🇵
Installed Capacity: ~89,077 MW
Utility-Scale Solar Cost: Higher costs due to land limitations and installation expenses
Germany 🇩🇪
Installed Capacity: ~81,739 MW
Utility-Scale Solar Cost: Competitive rates of $0.04–$0.05 per kWh
India 🇮🇳
Installed Capacity: ~89,431.98 MW (August 2024)
Utility-Scale Solar Cost: Among the lowest globally, at ₹2.50–₹3.00 per kWh ($0.03–$0.04 per kWh)
🇮🇳 India’s Solar Energy:
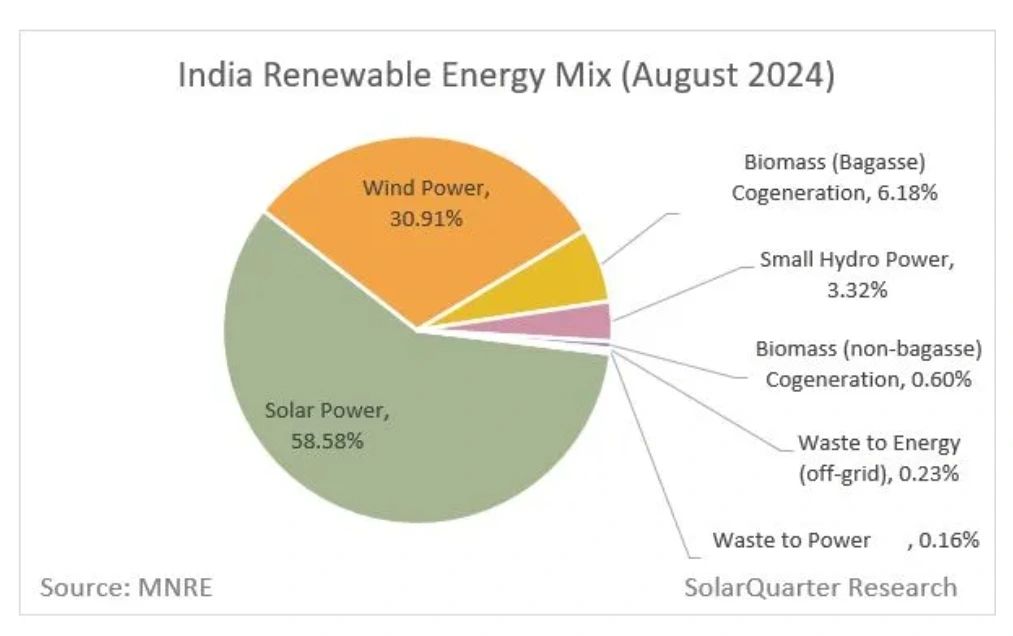
Installed Solar Capacity: 89,431.98 MW as of August 2024, contributing 58.58% of India’s renewable energy capacity (excluding large hydro).
Monthly Additions: In August 2024 alone, India added 2.224 GW, accounting for 93.5% of total renewable capacity additions that month.
Total Renewable Energy: Excluding large hydro, India’s total renewable energy capacity exceeds 152.65 GW, with solar and wind comprising 89.5% of this total.
💡 Why Solar Energy Costs Are Plummeting in India
1. Policy Support: Initiatives like the Production Linked Incentive (PLI) Scheme and mandated local manufacturing of solar cells have bolstered domestic production and reduced costs.
2. Technological Advancements: Innovations in PV technology and manufacturing have enabled significant economies of scale.
3. Global Leadership: India is leveraging its position as a top producer, attracting investments and partnerships to further drive down costs.
🚀 Opportunities for India
Global Competitiveness: India’s solar costs are among the lowest globally, making it an attractive market for investments.
Innovation in Materials: Developing climate-resilient and recyclable materials tailored for Indian conditions can further reduce costs.
Expanding Export Markets: India’s solar industry can capitalize on rising global demand for low-cost renewable energy solutions.
🌟 The Bottom Line
With solar energy prices as low as ₹2.50 per kWh ($0.03), India has emerged as a global leader in affordability and innovation. As investments pour in and technological advancements accelerate, solar energy is set to power not just India’s grids but also its ambitions of a sustainable future.
Originally published on LinkedIn on 2024-12-14 04:32:07: https://www.linkedin.com/feed/update/urn%3Ali%3AgroupPost%3A2474261-7273555330096070656
NamasteIndia…..“Howdy, Modi!” “Namaste Trump
Sisterhood Between Countries and Bromance Between Leaders: How India_US Relations Will Develop with Trump Returning to the White House?
With DonaldTrump now elected as the 47th President of the UnitedStates, he has expressed admiration for India and Prime Minister Narendra Modi, calling them both “magnificent.” This personal rapport between the leaders, combined with the strategic alignment of the two countries, lays the groundwork for a promising yet complex relationship. Here’s a look at how this “sisterhood” between the nations and “bromance” between the leaders might shape the future of India-US relations.
Strengthening Defense and Security Ties
Trump’s previous tenure saw him focus on defense partnerships with India, including arms sales and joint military exercises.
As a Major Defense Partner, India’s role in the Indo-Pacific is likely to grow, with Trump aiming to deepen these ties as a counterbalance to regional threats.
Trade Relations: Balancing Act
Trade was contentious under Trump, with tariffs on Indian goods and the revocation of India’s preferential trade status.
Both nations may aim to negotiate a balanced trade agreement that addresses these past disputes while fostering economic growth.
Immigration Policies and Skilled Workforce
Trump’s administration previously implemented stricter immigration policies, impacting Indian professionals in the tech sector.
While prioritizing American jobs will likely continue, there may also be an effort to balance this with India’s significance in the global tech landscape.
Strategic Cooperation in the Indo-Pacific
The Trump administration emphasized India’s role in the Indo-Pacific, including through collaborations like the Quadrilateral Security Dialogue (Quad).
As China’s influence grows, Trump is expected to promote India as a crucial ally, advocating for a free and open Indo-Pacific region.
Personal_Diplomacy and Public Engagement
The “bromance” between Trump and Modi was highlighted in events like “Howdy, Modi!” in Houston and “Namaste Trump” in Ahmedabad, which showcased their strong rapport.
This personal connection is expected to continue, with high-profile events likely reinforcing the symbolic and substantive strength of the India-US partnership.
In summary, Trump’s return to the White House signals both opportunities and challenges for India-US relations. While defense and strategic cooperation are set to deepen, issues like trade and immigration may require nuanced negotiations. With the “sisterhood” between the countries and the “bromance” between Trump and Modi, this critical partnership is well-positioned to evolve and adapt in a shifting global landscape.
Source / shared link: https://www.hindustantimes.com/india-news/pm-modi-dials-up-trump-says-looking-forward-to-work-together-again-101730912539575-amp.html
Originally published on LinkedIn on 2024-11-08 02:44:28: https://www.linkedin.com/feed/update/urn%3Ali%3Ashare%3A7260482279607558144
NamasteIndia checks WHO report claiming half of India’s population is physically unfit is based on extrapolations: Nadda
Let’s expand our health care comparison to include Europe China, and the UnitedStates:
1. Health Spending:
China**: Per capita health spending in China is significantly lower than in the U.S., India, and Europe.
India: India spends approximately $40 per person annually on health care.
USA: The United States allocates a staggering $8,500 per person each year.
Europe: European countries vary widely in health spending, but collectively they invest more than India and less than the U.S.
2. Health Care System Structure:
China: China’s health care system combines public and private elements, with a focus on expanding access and improving quality.
India: India’s system is decentralized, managed by states and territories, with rural access challenges.
USA: The U.S. system is complex, balancing public and private providers.
Europe: European countries have diverse systems, including single-payer models, social insurance, and mixed systems.
3. Health Outcomes and Priorities:
China: Addressing emerging diseases and financial risk protection are key priorities.
India: Improving access, especially in rural areas, remains crucial.
USA.: Despite high spending, the U.S. faces challenges in patient satisfaction and cost containment.
Europe: European nations prioritize universal access, preventive care, and equity.
Originally published on LinkedIn on 2024-08-02 18:10:16: https://www.linkedin.com/feed/update/urn%3Ali%3AgroupPost%3A60128-7225201251385266177

