Global ESG Market Size
→ $38 Trillion AUM (Assets Under Management), 2022
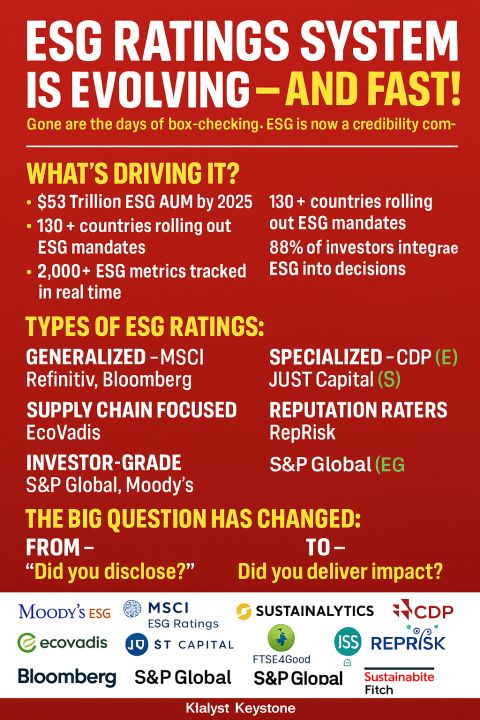
→ Expected to hit $53 Trillion by 2025 (Bloomberg)
Investor Trends
→ 88% of institutional investors integrate ESG
→ 75% say poor ESG ratings increase investment risk
Regulatory Wave
→ 130+ countries implementing ESG frameworks
→ EU’s CSRD impacts 50,000+ companies by 2026
Consumer & Talent Shift
→ 73% of millennials consider ESG before purchases
→ 65% prefer employers with strong ESG performance
Data Surge
→ 2,000+ ESG metrics tracked by leading raters
→ Real-time monitoring via AI & IoT on the rise
TopDrivers
Investor Demand
Regulatory Compliance
Risk Management
Reputation
Green Finance

Originally published on LinkedIn on 2025-04-01 20:53:30: https://www.linkedin.com/feed/update/urn%3Ali%3Ashare%3A7312940194670829568
AuditScandal: A Timeline_of_Lies, Exposure & Reckoning
📉 What drives financial fraud?
🚨 Greed. Pressure. Complacency. A broken system.
🔴 When numbers don’t match reality, companies have two choices—fix the problem or hide it.
🔴 When auditors see red_flags, they can raise them or turn a blind_eye.
🔴 When regulators step in, it’s often too_late—the damage is done.
⚖️ Ethics isn’t about policies—it’s about choices.
📉 When businesses trade integrity for short_term gains, they lose more than money. They lose trust.
💰 In Brightcom & CMIL’s case, deception_wasnot_an_accident—it was a choice. And they got caught.
📅 YR2014_2020: The Financial Mirage
🟢 Brightcom Group reports unstoppable growth.
🟢 Profits soar, investors celebrate, and markets trust the story.
🟢 But was it real success—or well-crafted deception?
📅 YR2020_2021: Whispers of Doubt
🔴 SEBI receives multiple complaints.
🔴 Allegations surface:
✅ Profits overstated
✅ Asset manipulation
✅ Non_compliance with accounting norms
📅 YR2021: The First_Strike
🔎 SEBI orders a forensic audit.
🚨 Findings? Brightcom’s numbers don’t add up.
🚨 The illusion starts to crack.
📅 YR2023: The Case Breaks Open
⚠️ SEBI issues a Show_Cause Notice.
⚠️ The findings?
✅ Fabricated profits
✅ Investors misled
✅ Promoters cashing in on inflated shares
📉 Trust? Shattered.
📅 YR2021_2023: The CMIL_Parallel
🔴 Meanwhile, CMIL is also under scrutiny.
📉 Revenue crashes from ₹637 Cr (FY19) to ₹201 Cr (FY21).
📉 Profits turn to ₹194 Cr loss—but auditors stay silent.
📅 2023: NFRA Steps In
🔎 Findings?
❌ No proper audit procedures.
❌ No checks on liabilities.
❌ No questions asked.
📅 YR2024: The Reckoning
💥 Regulators strike hard.
🔴 Brightcom Group Auditors:
✔️ Debarred & fined ₹80 lakh
🔴 CMIL Auditors:
✔️ Debarred & fined ₹60 lakh
🚨 The_Lesson? Prevention is Cheaper Than Punishment.
✅ Boards & IndependentDirectors must challenge audits.
✅ Surprise forensic audits need to become the norm.
✅ Investors deserve real transparency—not smoke & mirrors.
TheBigQuestion: Are We Learning?
🔹 Should auditors face criminal charges for fraud?
🔹 Are regulators too slow in catching corporate misconduct?
🔹 Would AI-driven audits prevent such failures?
🔹 Why aren’t whistleblowers speaking up sooner?
🔹 Is financial transparency still just a checkbox?
🚨 If we don’t fix this now, the next financial scandal is just waiting to happen.
💬 Your thoughts? Is prevention possible—or are we just waiting for the next collapse? 👇


Originally published on LinkedIn on 2025-02-12 07:00:05: https://www.linkedin.com/feed/update/urn%3Ali%3AgroupPost%3A2153908-7295335841441193985
NamasteIndia checks WHO report claiming half of India’s population is physically unfit is based on extrapolations: Nadda
Let’s expand our health care comparison to include Europe China, and the UnitedStates:
1. Health Spending:
China**: Per capita health spending in China is significantly lower than in the U.S., India, and Europe.
India: India spends approximately $40 per person annually on health care.
USA: The United States allocates a staggering $8,500 per person each year.
Europe: European countries vary widely in health spending, but collectively they invest more than India and less than the U.S.
2. Health Care System Structure:
China: China’s health care system combines public and private elements, with a focus on expanding access and improving quality.
India: India’s system is decentralized, managed by states and territories, with rural access challenges.
USA: The U.S. system is complex, balancing public and private providers.
Europe: European countries have diverse systems, including single-payer models, social insurance, and mixed systems.
3. Health Outcomes and Priorities:
China: Addressing emerging diseases and financial risk protection are key priorities.
India: Improving access, especially in rural areas, remains crucial.
USA.: Despite high spending, the U.S. faces challenges in patient satisfaction and cost containment.
Europe: European nations prioritize universal access, preventive care, and equity.
Originally published on LinkedIn on 2024-08-02 18:10:16: https://www.linkedin.com/feed/update/urn%3Ali%3AgroupPost%3A60128-7225201251385266177
NamasteIndia checks WHO report claiming half of India’s population is physically unfit is based on extrapolations: Nadda
Let’s expand our health care comparison to include Europe China, and the UnitedStates:
1. Health Spending:
China**: Per capita health spending in China is significantly lower than in the U.S., India, and Europe.
India: India spends approximately $40 per person annually on health care.
USA: The United States allocates a staggering $8,500 per person each year.
Europe: European countries vary widely in health spending, but collectively they invest more than India and less than the U.S.
2. Health Care System Structure:
China: China’s health care system combines public and private elements, with a focus on expanding access and improving quality.
India: India’s system is decentralized, managed by states and territories, with rural access challenges.
USA: The U.S. system is complex, balancing public and private providers.
Europe: European countries have diverse systems, including single-payer models, social insurance, and mixed systems.
3. Health Outcomes and Priorities:
China: Addressing emerging diseases and financial risk protection are key priorities.
India: Improving access, especially in rural areas, remains crucial.
USA.: Despite high spending, the U.S. faces challenges in patient satisfaction and cost containment.
Europe: European nations prioritize universal access, preventive care, and equity.
https://lnkd.in/dwy8PrTW
Originally published on LinkedIn on 2024-08-02 18:10:09: https://www.linkedin.com/feed/update/urn%3Ali%3Ashare%3A7225201221039493120
NamasteTaxIndia Unveiling India’s Tax-to-GDP Surprise!
Key points from Revenue Secratary SanjayMalhotra’s recent insights on India’s tax system:
India’s tax to GDP ratio is higher than commonly believed.
Proposed changes to the capital gains tax regime won’t harm the real estate sector.
Gradual formalization of the economy is bringing more people into the tax net.
The tax-to-GDP ratio, considering both central and state taxes, stands at approximately 18%.
This figure aligns reasonably well with income levels in various countries.
Overall, India’s tax system is performing better than often assumed.
Originally published on LinkedIn on 2024-07-26 19:13:41: https://www.linkedin.com/feed/update/urn%3Ali%3AgroupPost%3A2205762-7222680496084779009
NamasteTaxIndia Unveiling India’s Tax-to-GDP Surprise!
Key points from Revenue Secratary SanjayMalhotra’s recent insights on India’s tax system:
India’s tax to GDP ratio is higher than commonly believed.
Proposed changes to the capital gains tax regime won’t harm the real estate sector.
Gradual formalization of the economy is bringing more people into the tax net.
The tax-to-GDP ratio, considering both central and state taxes, stands at approximately 18%.
This figure aligns reasonably well with income levels in various countries.
Overall, India’s tax system is performing better than often assumed.
https://lnkd.in/dQCdB9JF
Originally published on LinkedIn on 2024-07-26 19:13:31: https://www.linkedin.com/feed/update/urn%3Ali%3Ashare%3A7222680453802037248
NamasteIndia Carbon Pricing the Future: India’s Quest for an Economical Climate Change
To address India’s sector-specific challenges in carbon pricing, a multi-faceted approach is necessary. For sectors like heavy industry and agriculture, which are difficult to decarbonize, targeted subsidies, technological innovation, and capacity-building initiatives could ease the transition. Additionally, the private sector’s proactive role and policy coherence are crucial for adapting the carbon pricing model to India’s unique context.
Alternatives to a comprehensive carbon pricing system include regulatory measures, subsidies for low-carbon technologies, and voluntary carbon markets. These can complement carbon pricing by addressing market failures and incentivizing green investments.
Globally, there are successful examples of carbon pricing systems. Sweden, for instance, has a robust carbon tax that has led to significant emissions reductions while the economy grew. The EU’s Emissions Trading System (ETS) is another example, demonstrating how cap-and-trade can effectively lower emissions across member states.
India can learn from these models, tailoring them to its own economic and environmental contexts to ensure a just and equitable transition towards a sustainable future.
Charting Pathways for India’s Carbon Market https://lnkd.in/drtHNkEf
Originally published on LinkedIn on 2024-06-12 11:48:04: https://www.linkedin.com/feed/update/urn%3Ali%3Ashare%3A7206623286598807554

