KtalystInsight | What Changed in Sustainability?
Q2_2025 Edition | DisruptionReloaded
♻️ Circular Economy Goes Big
Recycling is out. Reinvention is in.
$1.2T projected global market size by 2025—driven by polymer upcycling, closed-loop systems & fabric-to-fiber reinvention in fashion.
⚡ Energy Transition Accelerates
Renewables hit 65% of global electricity in Q2.
Solar: 44% | Wind: 29%
On-site generation and virtual power purchase agreements (VPPAs) are the new norm.
🚛 Supply Chains Go Green(er)
83% of companies are investing in greener logistics.
Think electric fleets, rail-first shipping, and carbon-labeled containers. Sustainability now travels with your goods.
🧪 Carbon Capture Breakthroughs
195 Mt of CO₂ targeted for capture in 2025.
From DAC units in Texas to algae-based urban pilots—carbon removal is no longer experimental.
🤖 Greenwashing Meets Its AI Match
AI is now double-edged: verifying ESG claims or generating false ones.
Expect platforms, not pledges, to prove sustainability.
🔮 Q3 Watchlist
New climate laws in EU, US & India
Green steel and SAF gaining investor love
ESG scoring standards under global review
Na ion battery
KtalystKeystone decodes what’s next, so your sustainability game isn’t reactive—it’s resilient.
GreenShift | ESGStrategy | KtalystKeystone | Circularity | CarbonTech | Q2Trends | SustainabilityLeadership
Originally published on LinkedIn on 2025-05-08 17:52:13: https://www.linkedin.com/feed/update/urn%3Ali%3Ashare%3A7326302925322899457
TARIFF SHOCKWAVES: INDIA AT THE CROSSROADS OF TRADE & STRATEGY
The 26% blow to Indian exports isn’t just a trade shock—it’s a wake-up call to diversify, digitize, and diplomatically reset our global strategy before the door to developed markets narrows further.
AnjuSharma, MD, KtalystKeystone
What Happened?
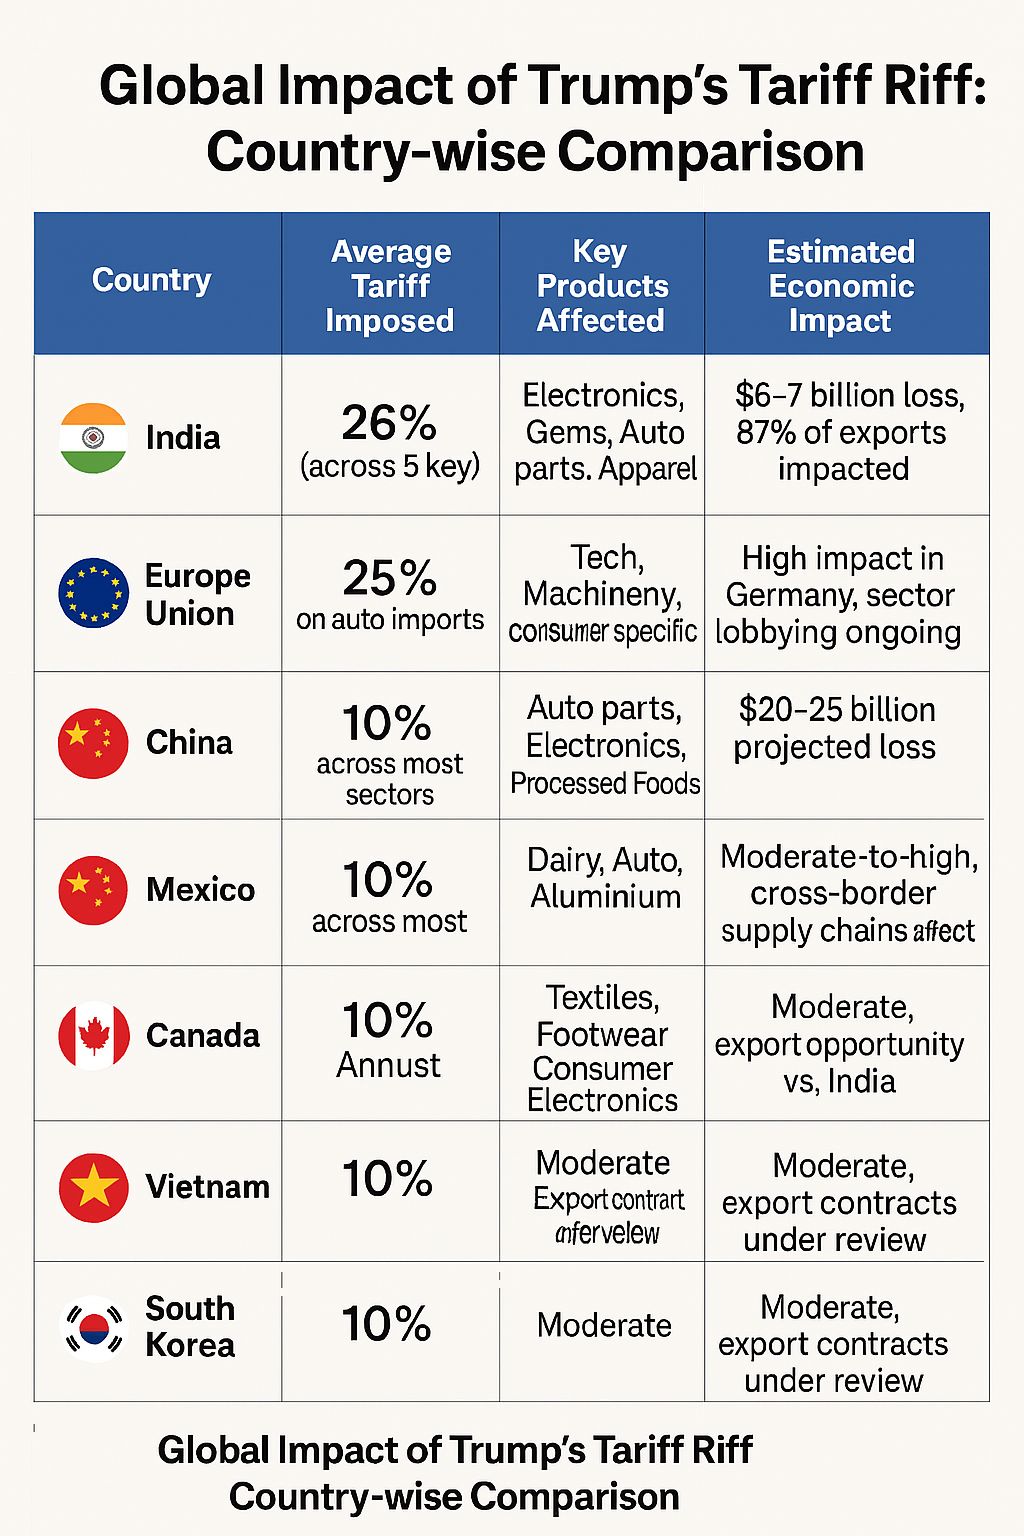
📌 10% universal tariff on all U.S. imports announced by President Trump
📌 India hit with 26% tariff on electronics, auto parts, gems, textiles & aluminium
📌 87% of India’s $66B U.S. exports impacted
📌 Estimated annual loss: $6–7 billion
Big 4 Speak Out
💬 PwC: “Tariff retaliation could balloon from $76B to $697B globally
💬 KPMG: “This isn’t trade policy—it’s political performance
💬 EY: “India must restructure global sourcing strategy immediately
💬 Deloitte: “Tariffs will inject stagflation into already strained supply chains
Financial Titans React
💸 Goldman Sachs:
Auto and textile exporters will bleed
Kroger, Valvoline may survive — India’s top B2B exporters will face margin heat
💹 Bloomberg Intelligence:
India risks losing emerging export edge to Vietnam & Mexico
📰 Wall Street Journal:
U.S. tariffs may trigger a regional pivot — India’s FTA urgency just jumped five notches
Market Pulse: Dalal Street Feels the Heat
📉 GIFT Nifty down 350+ pts
📉 Auto, IT, Jewellery, Aluminium stocks see heavy selling
📈 Shift towards domestic FMCG & retail as safe havens
What’s Next for India?
⚙️ Bilateral trade deal in pipeline by Fall 2025
🌍 Explore Middle East, Africa & ASEAN for export realignment
🛠️ Invest in supply chain localization + logistics infrastructure
📜 Fast-track FTA negotiations with EU, UK & Pacific allies
Final Takeaway
🚨 Tariffs aren’t just taxes—they’re tectonic shifts.
India must act with policy agility, strategic diversification, and bold diplomacy to stay ahead in a reshuffled global order.
Total Estimated Exposure
Indian Exports to U.S. Affected: ~$57–60 billion
Percentage of Total Indian Exports to U.S. Affected: ~87%
Estimated Annual Economic Loss: $6–7 billion
Trade Response & Outlook
Commerce Ministry View: “It’s a mixedbag, not a setback
Negotiation Status: Bilateral trade agreement targeted for Fall 2025
Market Impact:
GIFT Nifty: -350 pts (near 23,000)
Auto & IT stocks: Broad selling
Export-heavy stocks (like Titan, Motherson, Hindalco): Underperforming
Originally published on LinkedIn on 2025-04-03 04:42:34: https://www.linkedin.com/feed/update/urn%3Ali%3Ashare%3A7313420627510464512
PredictionPost: India’s Smart Playbook Could Turn Trade Turmoil into Triumph
April 2, 2025 isn’t just a reaction—it’s a redirection.
OurTake:
India’s rapid tariff concessions, tech-friendly signals, and energy diplomacy suggest a bigger play—positioning itself as a reliable, reform-ready trade partner just when global supply chains are rebalancing.
Data That Talks
1. U.S. Tariff Tsunami Is Real
🔸 #$1.4 trillion in imports now under “reciprocal tariffs” from the U.S.
🔸 Targeting countries like India, China, and EU for what the U.S. sees as unfair trade barriers.
(Source: TOI)
2. India’s Stakes Are High
🔸 #$87.4 billion – India’s 2024 exports to the U.S.
🔸 66B worth of goods now at risk due to new tariff duties
(Source: USTR & Reuters)
3. India’s Counter Move: Strategic Concessions
🔸 Tariff relief on 55% of U.S. goods worth #$23 billion
🔸 GoogleTax Gone – 6% tax repealed to woo global tech
🔸 Likely removal of LNG import duties
(Source: FT, Reuters)
4. Currency & Market Volatility Incoming
🔸 Rupee forecasted to dip below 85 INR/USD in next 12 months
🔸 NSE Nifty 50 down 0.25%, BSE Sensex slips 0.4%
(Source: Reuters)
5. Sectoral Deep Cuts
💎 Gems & Jewelry: $11.88B exports face 13.32% tariffs
💊 Pharma: $12.72B exports under 10.9% tariff gap
👚 Textiles: $2.76B worth now under 6.59% duty
(Source: Livemint)
OurPrediction
By Q4 2025, expect:
✅ A revamped US-India Trade Pact 2.0
✅ Rise in FDI inflows to tech and energy
✅ Short-term currency hit, long-term rupee rebound in 83–84 range
✅ India positioned as supply chain savior in the Indo-Pacific
BoardroomCue:
Geopolitics drives policy. Policy drives profit.
This isn’t just trade strategy—it’s global chess.
IndiaNext TradeTrends April2Update GlobalMarkets LeadershipLens FDIIndia BoardroomRadar DigitalIndia
Let’s not just read headlines—let’s lead with insight.

Originally published on LinkedIn on 2025-04-01 20:24:23: https://www.linkedin.com/feed/update/urn%3Ali%3AgroupPost%3A13927028-7312932866701647872
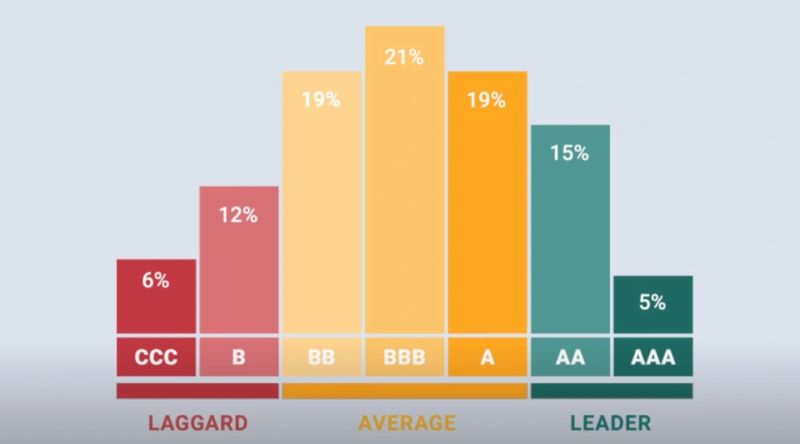
🚨 Moody’s & Sustainability: ESG is Now a Credit Rating Factor! 📊💚
With #$40T in ESG assets under management, Moody’s is reshaping how financial markets assess creditworthiness. No longer just about profits & losses, a company’s sustainability risks now directly impact credit ratings, borrowing costs, & investment potential.
🔍 How Moody’s Integrates Sustainability into Credit Ratings
🟢 ESG factors impact the credit ratings of 18% of companies & governments rated by Moody’s. (Source)
📊 Issuer Profile Scores (IPS): Measures 15 ESG subfactors (climate risk, governance strength, social responsibility).
📊 Credit Impact Scores (CIS): Rates how ESG performance affects a company’s credit rating & risk profile.
📊 Second Party Opinions (SPOs): Validates Green Bonds & Sustainability-Linked Loans, ensuring funds are climate-aligned.
🔹 Moody’s now assesses over 3,000 entities based on ESG factors.
💰 ESG & Financial Impact: Why Credit Ratings Depend on Sustainability
🏦 Banks & Investors Are Watching
📌 Companies with poor ESG ratings face higher borrowing costs, as investors demand sustainability-linked loans & bonds.
📉 Carbon-Intensive Companies Are High-Risk
📌 Firms with high Scope 3 emissions face 15-20% valuation risks due to carbon pricing & regulatory changes. (Source)
🚀 Sustainability-Linked Bonds & Loans Are Surging
📌 #$1.6T in sustainability-linked bonds & loans have been issued, with Moody’s validating green claims to prevent greenwashing. (Source)
🌍 Moody’s ESG Leadership: Recognitions & Market Influence
🏆 FTSE4Good Index Inclusion (6 Years Running) → Recognizing top ESG performers.
🏆 EcoVadis Bronze Medal → Top 35% of global companies for sustainability.
🏆 CDP Supplier Engagement Leader → Among the top 4% of companies driving supply chain decarbonization. (Source)
🔥 The Takeaway: Sustainability is No Longer Optional
🟢 18% of Moody’s rated companies now have ESG-driven credit adjustments.
🟢 Investors demand transparent sustainability metrics before lending.
🟢 Greenwashing is no longer profitable—credit ratings now hold companies accountable.
📢 Should ESG be an even bigger factor in credit ratings? Let’s discuss below! 👇

Originally published on LinkedIn on 2025-02-27 04:39:26: https://www.linkedin.com/feed/update/urn%3Ali%3AgroupPost%3A82951-7300736262829711360
📚 KnowledgeSeries: Understanding MACI SustainabilityRatings
With ESG investing surpassing $40 trillion, sustainability metrics are no longer optional—they directly impact financial markets. But traditional ESG ratings often miss the biggest contributor to emissions: Scope 3 (supply chain & product lifecycle).
Enter MACI (Morningstar Absolute Carbon Impact)—a next-gen sustainability metric designed to measure real carbon impact, beyond corporate disclosures.
🔎 What is MACI?
📌 MACI (Morningstar Absolute Carbon Impact) is a carbon-focused rating that quantifies total emissions, unlike traditional ESG scores that rely on self-reported data.
✅ Scope 1 – Direct emissions from company operations
✅ Scope 2 – Indirect emissions from purchased energy
✅ Scope 3 – Supply chain & product lifecycle emissions (often 80-95% of total emissions)
📊 Only 5% of companies currently disclose full Scope 3 data, despite it making up 75% or more of their total carbon footprint. MACI ensures investors see the full picture.
🌍 Why is MACI a Game-Changer?
🟢 Exposes True Carbon Impact
📌 Over 90% of S&P 500 companies report ESG data, but less than 30% include Scope 3 emissions. MACI forces transparency by measuring actual environmental impact.
💰 Links Carbon Impact to Financial Risk
📌 Firms with high Scope 3 emissions face 10-15% valuation risks due to carbon pricing, regulation, and shifting consumer demand. Investors using MACI can identify & price these risks early.
📊 Goes Beyond Traditional ESG Ratings
📌 MSCI, Sustainalytics, & CDP rely on corporate sustainability claims—but MACI measures actual emissions data. This removes greenwashing from ESG scores.
🚀 Guides Net Zero Investments
📌 81% of global companies have Net Zero goals, but only 19% have credible transition plans. MACI identifies companies actually reducing emissions, ensuring investors back real sustainability leaders.
💡 How Financial Markets Depend on MACI
🏦 Sustainable Finance
📌 #$500 billion in Green Bonds & ESG Funds rely on sustainability scores. MACI ensures these funds actually reduce carbon impact.
📉 Investment Risk Assessment
📌 Climate risk is now considered a financial risk. Regulated markets (EU, US, UK, APAC) require stricter carbon disclosure. MACI helps investors assess exposure before risks impact stock prices.
📜 Regulatory Compliance
📌 The EU Taxonomy, SEC Climate Disclosures, & IFRS ESG Standards will require comprehensive Scope 3 reporting. MACI aligns with these frameworks, ensuring compliance-ready investments.
🔥 The Takeaway
As corporate greenwashing grows, investors need credible carbon metrics that go beyond PR campaigns. MACI is setting the new standard for data-driven sustainability investing.

Originally published on LinkedIn on 2025-02-27 01:47:03: https://www.linkedin.com/feed/update/urn%3Ali%3AgroupPost%3A9088131-7300692883345412096
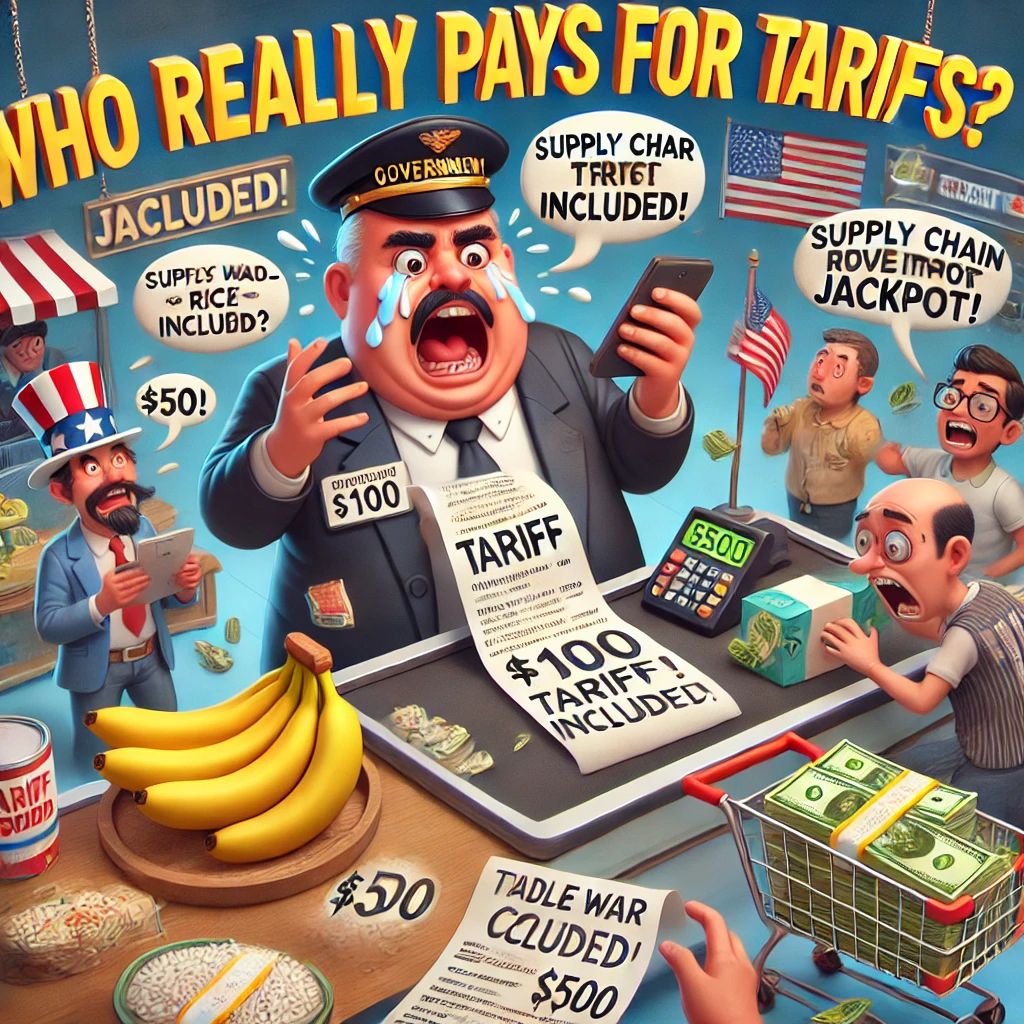
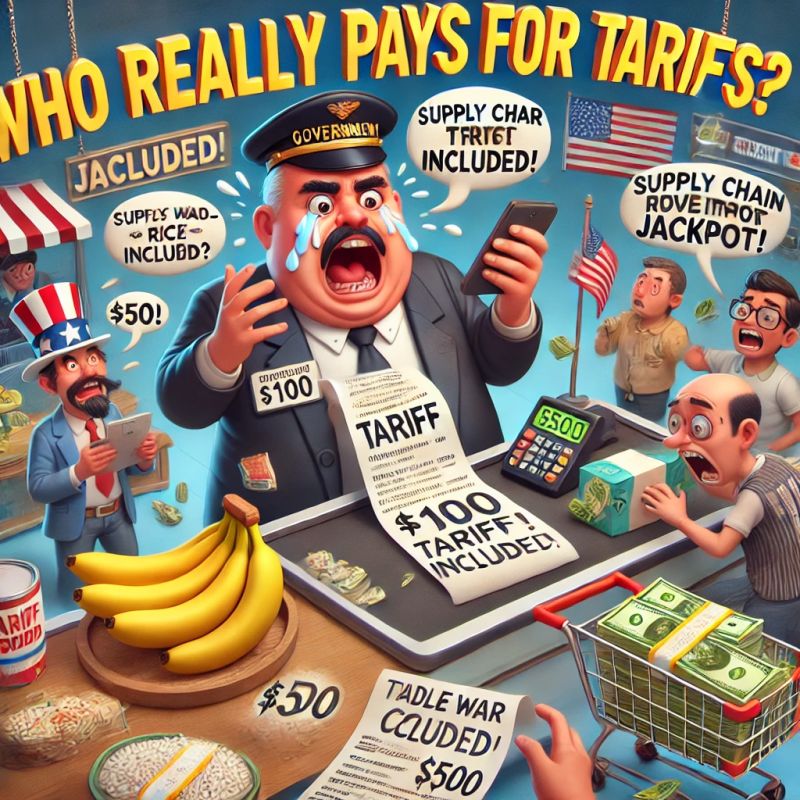
💰🌎 Tariff Wars: Who Really Pays the Price?
As governments escalate trade wars, businesses adjust supply chains, and consumers brace for price hikes, are tariffs truly protecting economies, or just shifting the cost?
🚨 Who Pays for Tariffs?
📉 Consumers Bear the Burden – 60% of tariff costs are passed on to consumers through higher prices. (IMF, 2024)
📉 Businesses Face Higher Costs – US companies paid $105B in tariffs since 2018, impacting supply chains. (USTR, 2024)
📉 Job Loss Risks – Tariffs on auto parts could cost 700K US jobs as production shifts. (Peterson Institute, 2024)
📉 Inflation Pressure – Every 10% tariff hike increases inflation by 0.5% globally. (World Bank, 2024)
📌 Reality Check: Tariffs aren’t just taxes on imports—they’re taxes on people.
🏆 Who Benefits?
✅ Governments Cash In – Tariffs generated $80B for the US Treasury in 2023. (USTR, 2024)
✅ Local Manufacturers Get Protection – Steel & aluminum industries saw a 20% production boost. (Reuters, 2024)
✅ Nearshoring Countries Profit – Mexico & Vietnam gained $65B in trade diversions from China. (IMF, 2024)
📌 Reality Check: While some industries win, the average consumer still loses.
🔮 What’s Next?
💡 Regional Trade Over Globalization – Supply chains are shifting closer to home to avoid tariff risks.
💡 Digital & AI Trade Solutions – Automated trade processing could reduce costs by 15%. (McKinsey, 2024)
💡 Green Tariffs Rising – Carbon-based tariffs will add new costs to imports, reshaping global trade. (EU CBAM, 2024)
📌 Reality Check: The cost of tariffs may outweigh the benefits if trade wars escalate.
🏆 KeyTakeaway
Tariffs could be a tool for protecting industries, should be used strategically, but would be an economic strain if prices keep rising.
👉 Who really pays for the trade war—governments, businesses, or you?
TradeWar Tariffs GlobalEconomy SupplyChainCrisis Inflation
Originally published on LinkedIn on 2025-02-05 16:37:39: https://www.linkedin.com/feed/update/urn%3Ali%3AgroupPost%3A2474261-7292944474018611204
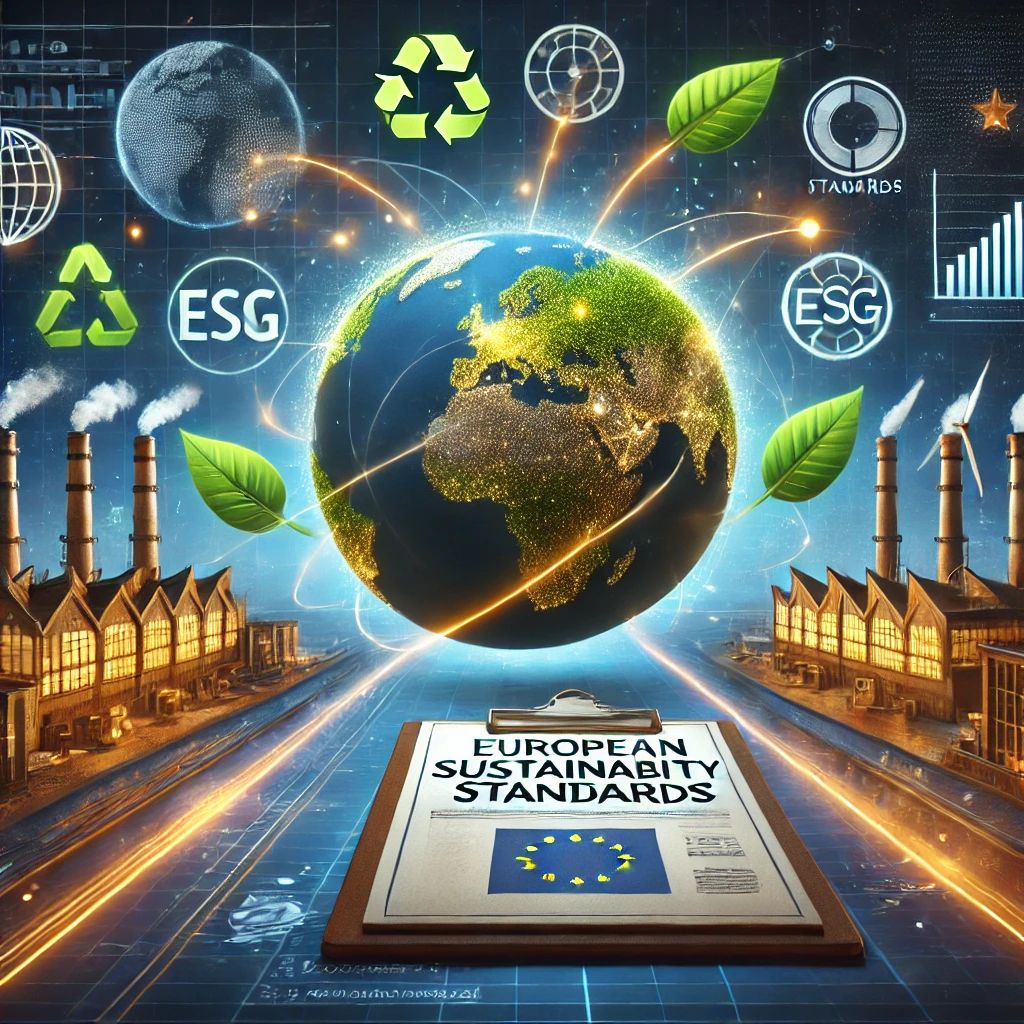
NamasteIndia ESRS_Ripple_Effect:Europe’s Global_Disruptor_Rules Reshape Indian Businesses” 🇮🇳
With the EU’s European Sustainability Reporting Standards (ESRS) coming into effect, Indian businesses are set to feel the heat. Here’s a data-driven breakdown of how these standards will impact India:
🔵 Indian Exporters Face Compliance Pressure
Fact: India exported goods worth #€65 billion to the EU in 2022, making the EU one of India’s largest trading partners. (Source: Eurostat)
Impact: Exporters must now meet ESRS-aligned requirements like carbon reporting, labor conditions, and water usage transparency.
Example: 45% of Indian textile exports go to the EU, which requires ESG disclosures from supply chains.
🟢 Subsidiaries of EU Companies Must Adapt
Fact: Over 4,000 EU-based companies have subsidiaries in India, spanning sectors like IT, pharmaceuticals, and manufacturing. (Source: EU Delegation to India)
Impact: Indian branches will face stricter ESG reporting as EU headquarters comply with ESRS.
Example: Indian operations of EU automotive giants must disclose scope 1, 2, and 3 emissions to support parent company reports.
🟡 Supply Chain Scrutiny to Intensify
Fact: 70% of EU companies rely on global supply chains, with India being a critical link. (Source: EFRAG)
Impact: Indian suppliers must provide accurate sustainability data or risk losing contracts.
Example: EU pharma imports from India, valued at #€8 billion annually, will require ESG-aligned disclosures like energy use and labor practices.
🟠 Regulatory Convergence in India
Fact: India’s BRSR framework, introduced in 2021, already mandates ESG reporting for the top 1,000 listed companies. (Source: SEBI)
Impact: ESRS accelerates India’s regulatory momentum, pushing companies to adopt global ESG benchmarks.
🟣 Opportunities in Green Tech and Consulting
Fact: The ESG consulting market in India is projected to grow at a CAGR of 35%, reaching #$1.2 billion by 2030. (Source: PwC India)
Impact: Indian firms offering ESG solutions—like software platforms for tracking emissions—stand to gain as EU firms outsource compliance support.
🔴 Competitive Advantage for ESG Leaders
Fact: 83% of EU investors prefer companies with strong ESG credentials. (Source: EY)
Impact: Indian companies with advanced sustainability practices will become preferred partners for EU buyers.
Example: Tata Steel’s carbon-neutral initiatives make it a strong supplier for ESG-conscious European firms.
Key Stats That Matter
#€85 billion: Total trade between India and the EU in 2022. (Source: Eurostat)
4,000+: EU-based companies with operations in India. (Source: EU Delegation to India)
35% CAGR: Growth of India’s ESG consulting market by 2030. (Source: PwC)
👉 Are Indian companies ready to navigate the ESG revolution and seize the opportunity?
SustainabilityLeadership ESRSImpact IndiaAndEU ESGCompliance GreenEconomy
Originally published on LinkedIn on 2025-01-27 11:33:17: https://www.linkedin.com/feed/update/urn%3Ali%3AgroupPost%3A3880479-7289606387402207232
🌟 India’s Chemical Industry: The Catalyst for Global Leadership (2025–2030) 🌟
The #$4 trillion global chemical industry is evolving rapidly, with trends like green chemistry, digital transformation, and supply chain diversification shaping its future. By 2030, the market is set to grow to #$5.5 trillion, and India has a golden opportunity to lead the charge. 🚀
Why India’s Chemical Industry is a Game-Changer
✅ Economic Engine: Contributes 7% to GDP; projected to hit 9% by 2030.
✅ Export Potential: Current exports at #$30 billion, with a target of #$60 billion.
✅ Job Creation: Can generate 2 million new jobs in specialty and green chemicals.
✅ Sustainability Leadership: Opportunity to capture 10%-15% of the #$150 billion green chemical market.
Global Trends: Challenges & Opportunities
🌍 China’s Dominance:
Controls 35% of the global chemical market.
Investing #$300 billion in green hydrogen and renewable feedstocks.
Pivoting to high-value specialty chemicals.
💡 Opportunity for India:
Reduce 33% import dependency (primarily on China).
Leverage PLI schemes for specialty and bio-based chemicals.
Build world-class chemical hubs and integrated logistics infrastructure.
📊 Global Sustainability Push:
Bio-based materials growing at a CAGR of 12%.
Over 50% of global chemical firms adopting digital supply chains by 2030.
India’s Roadmap for 2030
🔹 Market Expansion: Grow the domestic market to #$400 billion at an 8% CAGR.
🔹 R&D Investments: Increase spending to 1% of industry revenue (vs. current 0.3%-0.5%).
🔹 Skill Development: Train 500,000 professionals in green and digital technologies.
🔹 Sustainability Incentives: Develop bio-refineries and scale carbon-neutral production
The Numbers That Matter
💬 The Takeaway: India’s chemical industry is more than just a sector—it’s the foundation for sustainable growth, global competitiveness, and economic resilience. With the right policies, investments, and innovation, India can lead the global stage by 2030. 🌱
Let’s build a greener, stronger, and more self-reliant future. 💼💡
ChemicalIndustry IndiaGrowth Sustainability MakeInIndia 2030Vision
Source / shared link: https://m.economictimes.com/industry/indl-goods/svs/chem-/-fertilisers/budget-2025-chemical-industry-seeks-tweaking-in-customs-duties-to-boost-manufacturing/articleshow/117429274.cms
Originally published on LinkedIn on 2025-01-22 11:41:38: https://www.linkedin.com/feed/update/urn%3Ali%3AgroupPost%3A3880479-7287796548950745088
NamasteIndia reads Fashion industry is a significant contributor to global greenhouse gas (GHG) emissions, accounting for an estimated 3% to 8% of the total¹.
Many fashion brands are struggling to meet their decarbonization targets¹².
High Emissions: The fashion industry emits around 2.1 billion metric tons of GHGs annually².
Decarbonization Challenges: About two-thirds of fashion brands are behind on their decarbonization schedules, with 40% seeing an increase in emissions since making sustainability commitments¹.
Supply Chain Impact: A significant portion of emissions comes from the supply chain, particularly in manufacturing countries like Bangladesh, China, India, and Vietnam¹.
Collaborative Efforts: Bestseller, Gap Inc., H&M Group, and Mango, are collaborating to share the costs and responsibilities of reducing CO2 emissions in the supply chain⁴⁹.
References
(1) Sustainable style: How fashion can afford decarbonization | McKinsey. https://lnkd.in/d3p8jfEx.
(2) How the fashion industry can reduce its carbon footprint | McKinsey. https://lnkd.in/dyRsnJd5.
(3) Fashion Giants Join Forces to Share Cost of Supply Chain …. https://lnkd.in/dU5N8JHe.
(4) Major brands commit to innovative collective financing model to …. https://lnkd.in/dFQ9_tm6.
(5) Six cost-effective ways fashion brands can decarbonise. https://lnkd.in/dcf6FEg2.
(6) Fashion brands, part of high-emitting industry, hide decarbonisation plans. https://lnkd.in/dGsgY246.
(7) Why fixing fashion’s pollution crisis requires big brands to share the cost. https://lnkd.in/ddMFsiET.
(8) Six cost-effective ways fashion brands can decarbonise – MSN. https://lnkd.in/dqxc9rp8.
(9) Fashion brands falling behind on decarbonisation targets. https://lnkd.in/dhBSVZFw.
(10) Fashion Brands Unite To Decarbonise The Sector. https://lnkd.in/dnGh7vQH.
https://lnkd.in/d3p8jfEx
Originally published on LinkedIn on 2024-08-09 20:42:21: https://www.linkedin.com/feed/update/urn%3Ali%3AgroupPost%3A2474261-7227776240793866240

