TheGreenShield: Why Some Economies Bend Less in Disruptions
Dr. Anju Sharma•MrsSustainability
WTI settled near $111.54/bbl after briefly touching $113.97, while Brent closed around $109.03/bbl. This is not just an oil story.
The Strait of Hormuz carries about one-fifth of global oil flows, and the IEA says about 80% of oil and oil products moving through it in 2025 was headed to Asia.
The IEA also says more than 110 bcm of LNG passed through Hormuz in 2025, nearly one-fifth of global LNG trade.
Food follows fuel. FAO says its March 2026 Food Price Index rose 2.4% month on month & Reuters’ coverage of the release notes it was about 1% above March 2025. In the same update, wheat rose 4.3% and sugar 7.2%.
FAO’s warning is duration-driven: if disruption lasts beyond roughly 40 days, fertilizer and farm-input stress can alter planting decisions and keep food inflation pressure alive into 2027.
The third shock is growth. The cleaner way to say it is not that “Asia absorbs 40% of global energy imports,” but that Asia is the main buyer at the chokepoint.
India’s crude import dependence is about 88%, Japan imports nearly all its crude, and South Korea relies on imports for almost 98% of fossil-fuel consumption. Reuters, citing ADB, says that in a disruption lasting more than a year, inflation in developing Asia-Pacific could rise by up to 3.2 percentage points and growth could fall by up to 1.3 percentage points across 2026–27.
Who bends less?
France & Spain are relatively better insulated because stronger nuclear and renewables capacity reduces gas sensitivity, according to the IMF.
US has a different shield: scale. The EIA expects U.S. crude production to average about 13.6 mb/d in 2026, and Reuters reported U.S. LNG exports hit a record 11.7 million metric tons in March 2026.
The contrast is visible in exposed economies. Reuters reports Pakistan raised diesel prices by 54.9% and petrol by 42.7%, showing how quickly fossil dependence becomes inflation stress, fiscal strain, and social pressure.
A renewable-heavy grid is not just climate policy. It is inflation defense.
Biofuels are not just transition optics. They are fuel optionality.
Nuclear is not just baseload. It is shock absorption.
Diversification is not just sustainability. It is economic design.
For years, sustainability was framed as virtue.
In 2026, it looks more like crisis insurance.
The countries that bend less when energy wars begin are not lucky. They are built differently.” Dr. Anju Sharma
Originally published on LinkedIn on 2026-04-03 22:27:00: https://www.linkedin.com/feed/update/urn%3Ali%3Ashare%3A7445960069818515458
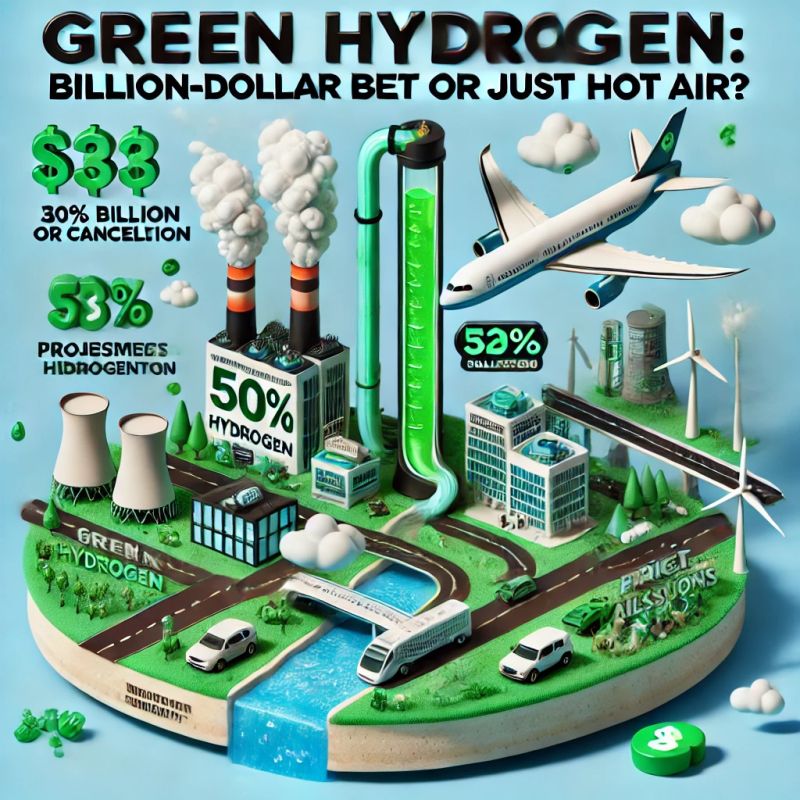
⚡🌍 Green_Hydrogen: Billion_Dollar_Bet or Just Hot Air?
💰 USD320 Billion. That’s how much global green hydrogen investments are expected to hit by 2030. (IEA, 2024)
💨 80 Million Tons. That’s the world’s hydrogen demand—yet only 0.5% comes from green sources. (Hydrogen Council, 2024)
🚀 #$1.50/kg. That’s the break-even cost for green hydrogen to compete with fossil fuels, but only 10% of projects are hitting this target. (BloombergNEF, 2024)
📌 Reality Check: Is green hydrogen scaling fast enough or suffocating under its own hype?
🌍 Game-Changers: Who’s Leading the Hydrogen Race?
🇳🇴 Norway & 🇩🇪 Germany: Floating Hydrogen Terminal
✅ #$3 Billion Project – First floating hydrogen hub to supply 1.3 million tons of green hydrogen annually. (Reuters, 2024)
✅ Price Target: $3-$3.5/kg—50% cheaper than current European hydrogen costs. (IEA, 2024)
✅ Operational By: 2027.
🇪🇸 Spain: Cepsa’s €3B Hydrogen Hub
✅ 2 GW of green hydrogen capacity planned by 2030. (Reuters, 2024)
✅ Phase 1: 400 MW by 2027, reducing 6 million tons of CO₂ annually.
📌 Reality Check: Green hydrogen is growing—but is it growing fast enough?
❌ Setbacks: Why Are Big Projects Failing?
🇦🇺 Australia: $12.5B Hydrogen Project Canceled
❌ Queensland pulled funding for its largest hydrogen project due to skyrocketing costs. (CourierMail, 2024)
❌ Kansai Electric withdrew, citing lack of commercial viability.
🇦🇺 BP’s $600M Hydrogen Hub Shelved
❌ BP paused its green hydrogen project in Western Australia, raising doubts over economic feasibility. (Hydrogen Insight, 2024)
📌 Reality Check: Over 50% of hydrogen projects risk delay or cancellation due to high costs & supply chain challenges. (Hydrogen Council, 2024)
✈️ Hydrogen-Powered Flight: The Next Big Bet?
🚀 ZeroAvia’s Hydrogen Aircraft Takes Off
✅ First 19-seat plane powered by hydrogen-electric engines. (Time, 2024)
✅ Raised #$150M from Airbus, Amazon, & Bill Gates’ Breakthrough Energy Fund.
✅ Commercial hydrogen flights targeted for 2025.
📌 Reality Check: Hydrogen aviation could cut emissions by 90%, but cost & infrastructure remain barriers.
🏆 KeyTakeaway
💡 Green Hydrogen could be the game-changer for clean energy, should be scaled urgently, but would be another overhyped tech if costs don’t fall fast.
👉 Are we heading for a green hydrogen boom or bust?
HydrogenEconomy NetZero CleanEnergy Sustainability GreenHydrogen EnergyTransition
Originally published on LinkedIn on 2025-02-06 18:33:57: https://www.linkedin.com/feed/update/urn%3Ali%3Ashare%3A7293336130429546496
Global Leaders in Ethanol Blending in Fuel: India’s Role and Achievements
NamasteIndia ranks among the top ethanol producers globally, alongside the US and Brazil. Tops Countries
1. US: The largest producer and consumer of ethanol, Production: 876K barrels Consumption 838K barrels per day.
2. Brazil: Produces 403K barrels per day and consumes 359K barrels per day.
3. China: Produces and consumes 43K barrels per day.
4. Canada: Produces 33K barrels per day; consumes 41K barrels per day.
5. France: Produces 17K barrels per day & consumes 13 thousand barrels per day.
6. Germany: Produces 13K barrels per day and consumes 27K barrels per day.
7. Colombia: 8.5K barrels/day (produces), 6.1K barrels/day (consumes).
8. Thailand: 8.1K barrels/day (produces), 9.1K barrels/day (consumes).
9. Guatemala: 8K barrels/day (produces).
10. Spain: 7.9K barrels/day (produces), 8K barrels/day (consumes).
11. Belgium: 6.8K barrels/day (produces), 1.8K barrels/day (consumes).
12. India: 5.3K barrels/day (produces & consumes).
13. Australia: 5.3K barrels/day (produces), 5.1K barrels/day (consumes).
14. UK: Produces 4.3 thousand barrels per day and consumes 17 thousand barrels per day.
India’s Ethanol Blending in Gasoline Industry
Key_Facts_&_Figures
Ethanol Blending Target: India aims to achieve 20% ethanol blending in gasoline by 2025, a goal accelerated from the original target of 2030.
Current Blending Level: As of May 2024, India has achieved a 15% ethanol blending rate.
Economic Impact: A successful ethanol blending program can save India approximately $4 billion (₹30K crore) annually by reducing oil imports.
Production Volume: India plans to produce around 10 billion liters (1,000 crore liters) of ethanol to meet the 20% blending target.
Role of Key Stakeholders
Government:
Policy Framework: The government has implemented policies like the National Policy on Biofuels.
Pricing and Incentives: The government administers ethanol prices and provides incentives to encourage production and blending.
Oil Marketing Companies (OMCs):
Procurement: OMCs issue annual tenders to procure ethanol from producers.
Blending and Distribution: OMCs blend ethanol with gasoline at designated depots and distribute the blended fuel to retail stations.
Sugar Industry:
Production: The sugar industry is a major producer of ethanol, utilizing by-products like molasses. Leading companies include Bajaj Hindusthan Sugar Ltd., Balrampur Chini Mills Ltd., Shree Renuka Sugars Ltd., and Dhampur Sugar Mills Ltd., contributing significantly to the total ethanol production.
Environmental impact: supports bioenergy production and waste utilization but also faces challenges like high water usage and pollution.
Originally published on LinkedIn on 2024-09-25 05:31:06: https://www.linkedin.com/feed/update/urn%3Ali%3AgroupPost%3A60128-7244579146016641026
NamasteIndia ranks 6th in the top 14 countries producing wind power as of 2023, along with their percentage increase in wind power capacity over the last 10 years:
1. China: 885 TWh (+190%)
2. United States: 425 TWh (+70%)
3. Germany: 137 TWh (+40%)
4. Brazil: 95 TWh (+210%)
5. United Kingdom: 82 TWh (+60%)
6. India: 71 TWh (+50%)
7. Spain: 60 TWh (+30%)
8. France: 45 TWh (+80%)
9. Canada: 35 TWh (+50%)
10. Italy: 30 TWh (+25%)
11. Sweden: 28 TWh (+90%)
12. Australia: 25 TWh (+120%)
13. Turkey: 22 TWh (+100%)
14. Netherlands: 20 TWh (+150%)
Future_Potential:
China: Exceptional wind resources due to its large land mass and long coastline.
United_States: Vast areas with high wind speeds, especially in the Midwest.
Germany: Consistent wind flow in the North Sea region.
Brazil: Strong wind flow in coastal regions.
United Kingdom: Excellent wind conditions, particularly offshore.
India: Significant potential in coastal areas like Tamil Nadu and Gujarat, and hilly regions such as Himachal Pradesh.
Countries with Untapped Wind_Power_Potential:
Russia: Despite significant wind potential, it generated less than 1% of its electricity from wind in 2023.
Japan: Has strong wind resources but has not fully developed its wind power infrastructure.
South_Korea: Similar to Japan, it has good wind potential but limited development.
These countries have the right wind conditions to further increase their wind power capacity in the future.
Originally published on LinkedIn on 2024-09-19 10:31:36: https://www.linkedin.com/feed/update/urn%3Ali%3Ashare%3A7242480441604161536

