📚 KnowledgeSeries: Sustainability Taxonomy – The Rulebook for Green Investments 🌱💰
As #$5T in ESG investments grows, defining what is truly sustainable is critical. Enter Sustainability Taxonomy—a classification system ensuring green capital flows into real climate solutions, not greenwashing.
📊 EU Taxonomy – Setting the Global Standard
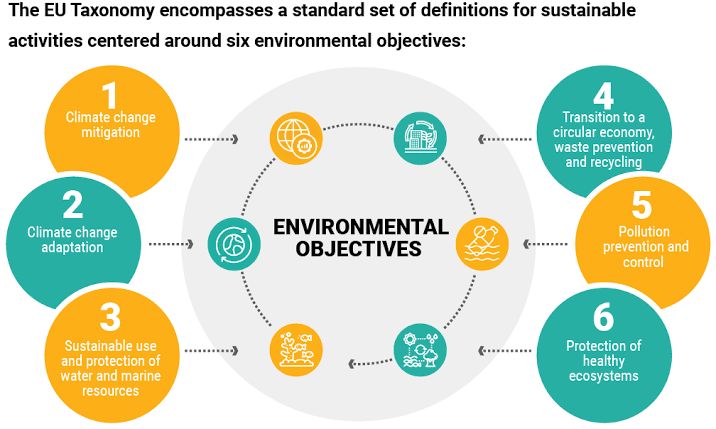
🟢 6 Environmental Objectives → Activities must significantly contribute to at least one while causing no harm to others:
Climate Change Mitigation
Climate Change Adaptation
Water & Marine Resource Protection
Circular Economy Transition
Pollution Prevention & Control
Biodiversity & Ecosystem Restoration
🟢 Impact → Covers 50K+ companies, shaping 80% of EU capital markets. (Source)
🟢 Challenges → Simplification Omnibus (2025 Proposal) could reduce company reporting, raising concerns about greenwashing risks. (Source)
🌍 Global Adoption: Who’s Following the EU Model?
🟢 Australia → Developing Sustainable Finance Taxonomy to attract #$200B+ in green capital. (Source)
🟢 China → Green Bond Principles aligned with EU Taxonomy in 2023, covering #$150B+ in issuances.
🟢 ASEAN → Launched ASEAN Taxonomy 2024, targeting climate finance growth in 10 nations.
🟢 US & UK → No official taxonomy, relying on SEC climate rules & UK Green Finance Strategy instead.
🔥 The Takeaway: Green Finance Needs Clear Rules
📌 #$5T+ ESG investments need clarity—taxonomy prevents greenwashing.
📌 EU model sets the benchmark, but simplification risks loosening standards.
📌 More countries adopting taxonomies → Will we see a global standard soon?
📢 Do we need a worldwide taxonomy for sustainability? Let’s discuss! 👇
Originally published on LinkedIn on 2025-03-04 03:47:30: https://www.linkedin.com/feed/update/urn%3Ali%3AgroupPost%3A2474261-7302535131989164034
NamasteYouthIndia
Leaving Carbon Footprints: Who’s the Bigfoot?
India, now the world’s most populous country with a median age of 28, boasts the largest youth demographic globally. Despite this, India’s per capita consumption and carbon footprint remain significantly lower than those of other major economies.
Food Consumption:
India:
Rural: 46% of household expenditure on food; approximately 2,081 kcal/day per capita.
Urban: 39% of household expenditure on food; approximately 1,943 kcal/day per capita.
UnitedStates: Approximately 3,800 kcal/day per capita.
China: Approximately 3,400 kcal/day per capita.
Europe: Approximately 3,400 kcal/day per capita.
Electricity Consumption:
India: 1,395 kWh/year per capita (2024), a 36% increase over 5 years.
UnitedStates: Approximately 12,000 kWh/year per capita, about 9 times India’s consumption.
China: Approximately 5,500 kWh/year per capita, about 4 times India’s consumption.
Europe: Approximately 5,800 kWh/year per capita.
Water Consumption:
India: 1,500 m³/year per capita, a 20% decline over two decades.
UnitedStates: Approximately 3,800 m³/year per capita.
China: Approximately 2,000 m³/year per capita.
Europe: 1,200–1,500 m³/year per capita.
Carbon Footprints:
India: 1.89 metric tons CO₂/year per capita.
United States: 14.21 metric tons CO₂/year per capita.
China: 8.89 metric tons CO₂/year per capita.
Europe: Approximately 5.8 metric tons CO₂/year per capita.
Highlights:
India: Despite having the largest and youngest population, India maintains the lowest per capita consumption and carbon footprint among major economies.
United States: Exhibits the highest per capita energy and water usage, resulting in a substantial carbon footprint.
China: Rapid industrial growth contributes to significant increases in consumption and emissions.
Europe: Demonstrates balanced consumption with moderate emissions and efficient resource utilization.
India’s disciplined consumption patterns amidst a burgeoning, youthful population underscore its commitment to sustainable growth.
Originally published on LinkedIn on 2024-12-05 14:35:38: https://www.linkedin.com/feed/update/urn%3Ali%3Ashare%3A7270445719734415361

