NamasteIndia Built_for_the_World
Dr. Anju Sharma
Policy Builds the Framework. Politics Enables the Corridor. People Deliver the Returns
1️⃣ The Runway Is Already Built ✈️
▪ EU–India trade is not a concept—it’s ~€120B live traffic
▪ The deal unlocks +25–30% altitude over 5–7 years
▪ Growth comes from cleaner flight paths, not heavier cargo
2️⃣ The Fog Lifts from Pricing
▪ Tariff rationalisation (~4–8%) sharpens price visibility
▪ CBAM (€80–120/tonne CO₂) turns into a line item, not a shock
▪ Markets reward clarity. Confusion lives in DataComa.
3️⃣ The Margin Firewall Activates
▪ Verified carbon data shields 10–30% EBITDA
▪ Assurance converts compliance into pricing power
▪ Carbon is no longer a belief systemit’s margin insurance
4️⃣ Capital Learns Whom to Trust
▪ EU banks and insurers now separate ready from risky
▪ Audit-ready exporters earn 50–150 bps funding advantage
▪ Lower spreads = higher ROCE, stronger multiples
5️⃣ NamasteIndia Upgrades from Scale to Signal 📡
▪ Cost + speed + assurance = financeable scale
▪ India shifts from low-cost sourcing to trusted corridor partner
▪ Capital flows where execution speaks louder than intent
KtalystInsights
This trade deal is not about exporting more.
It’s about compounding better.
Markets don’t punish cost. They punish uncertainty.
Kill the DataComa & capital will follow.
Dr. Anju Sharma
KtalystInsights DrAnjuSharma
EUIndiaTrade PolicyPoliticsPeople
TradeIsFinance CapitalEfficiency
DataComa RiskAdjustedGrowth
CBAM BoardroomMath
SustainableScale NamasteIndia Ktalystklues
Originally published on LinkedIn on 2026-01-27 08:01:54: https://www.linkedin.com/feed/update/urn%3Ali%3AgroupPost%3A39683-7421824760805838849
Is_the_West_Over?
Or DidDependenceJustGetExpensive?
Dr. Anju Sharma
KtalystInsights™ | MrsSustainability
Reading the WSJ write it reminded me….Every few decades, someone asks: “Is the West finished?
It sounds geopolitical. It isn’t.
TheSharperTruth:
West & East were never just geography. They were where returns clustered.
Capital doesn’t follow maps.
It follows risk-adjusted returns.
Let’s review the TheBusinessCycles
1️⃣ FrontierReturns
1500s–1800s: land, resources, low competition
Frontier economies delivered 2–3× higher marginal returns than mature European markets
Ktalystinsights: Capacity followed unconstrained upside
2️⃣ ScaleEconomics
1800s–1945: industrialisation + standardisation
Mass production cut unit costs by 60–80% across textiles, steel, energy
Ktalystinsights Dominance came from scale, not borders
3️⃣ InstitutionalRiskCompression
Post-WWII: Bretton Woods, WTO, rule-based trade
Global cost of capital fell steadily; real interest rates declined ~300–400 bps over decades
Ktalystinsights Stability accelerated value creation
4️⃣ Labour & CostArbitrage
1990s–2010s: offshoring + global supply chains
Manufacturing labour costs in Asia were 70–90% lower than OECD averages
Result: sustained margin expansion across consumer goods, electronics, chemicals
Ktalystinsights Efficiency globalised. Dependence accumulated.
5️⃣ RiskRepricing (Now)
This is the shift people misread as “collapse”.
What actually changed:
Supply-chain disruptions increased 3–5× post-2020
Inventory buffers rose 20–30% across industrial sectors
Governments announced $1.5+ trillion in subsidies for energy, semiconductors, defence, and clean tech
Ktalystinsights Resilience now carries a price tag.
⚠️ What’s really happening
People say: “Everything is breaking.
That’s lazy analysis.
Not everything is breaking.
The pricing is changing.
We’re seeing mean reversion in:
Input costs (energy, freight volatility)
Supply concentration (China+1, friend-shoring)
Geopolitical risk premiums (insurance, compliance, capital allocation)
🔄 The mechanism (unchanged, undeniable)
Capital flows to the highest risk-adjusted returns.
When costs rise or risk shifts, flows rotate.
No ideology.
No nostalgia.
Just portfolio logic playing out again.
🎯 Strategic implication (with numbers in mind)
Higher insurance & compliance costs
Higher working capital
Higher cost of disruption than inefficiency
Dependence was cheap, until it wasn’t.
The world didn’t de-globalise.
It simply sent dependence the bill.
Dr. Anju Sharma
Source / shared link: https://www.wsj.com/world/europe/is-the-west-over-d706607d?st=Z4yxrQ
Originally published on LinkedIn on 2025-12-26 18:50:34: https://www.linkedin.com/feed/update/urn%3Ali%3Ashare%3A7410391592735428609
Protectionism is temporary. Strategy is forever.” – KtalystKeystone
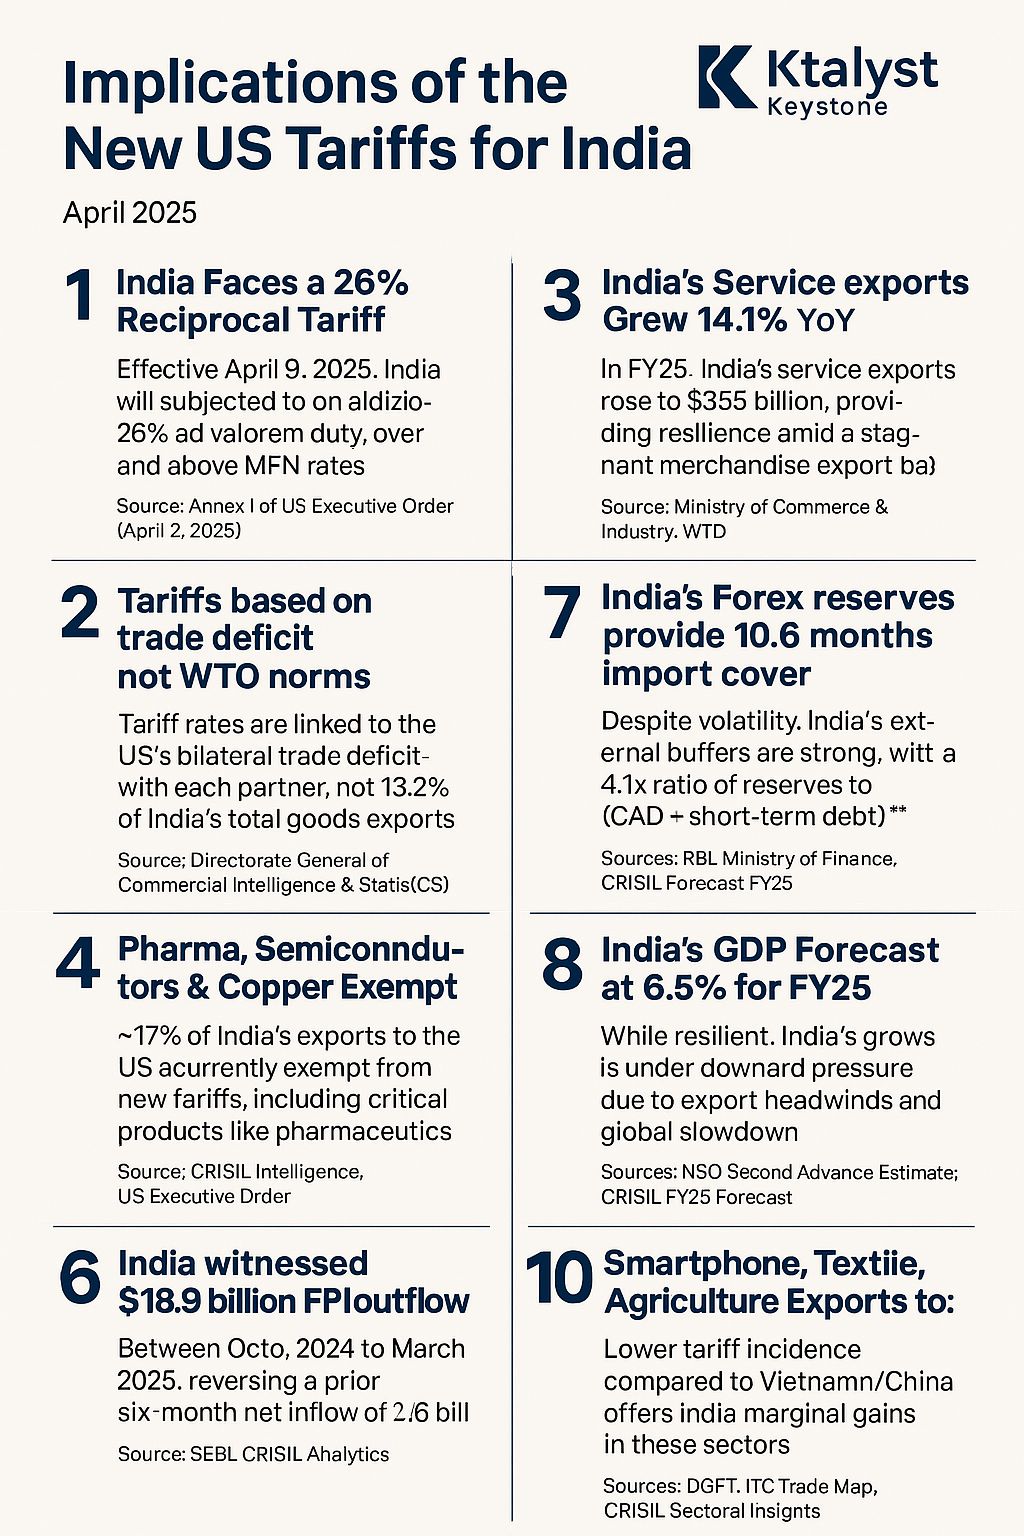
Insights from the April 2025 CRISIL Report on US Tariffs & India:
The 26% tariff isn’t just a tax — it’s a test. A test of India Inc.’s resilience, agility, and strategic depth.
India’s export engines may sputter, but its services superpower and domestic strength are the new fuel.
StrategicViewpoint | What IndianBusinesses Must Do Now
🔍 RethinkExportDependency
High-risk sectors like GemsAndJewellery (with 37% exports to US) must unlock new geographies — EU, GCC, ASEAN.
📦 LeverageServicesBoom
With service exports clocking 14.1%YoY growth, the pivot to digital, consulting, and R&D is more than necessary — it’s non-negotiable.
⚙️ LocalizeValueChains
Auto and Electronics firms must evaluate USMCA partnerships and nearshoring to maintain tariff competitiveness.
📈 HedgeWisely
$18.9B of FPI outflows signal clear volatility. CFOs, it’s time to sharpen your forex strategy and revisit pricing models.
🛡️ UseIndiaPolicyCushion
The PLI schemes, ongoing capex push, and FTA progress (esp. with UK & EU) can soften the blow.
🌱 StayResilientStayStrategic
India’s #$355B service exports, 10.6 months import cover, and low CAD are not just stats — they’re shock absorbers.
KtalystKeystone | CatalysingStrategy in Disruptive Times
TradePolicy GlobalMarkets IndiaUS TariffWatch Exports Geopolitics MakeInIndia KtalystPerspective LinkedInPulse

Originally published on LinkedIn on 2025-04-08 17:38:16: https://www.linkedin.com/feed/update/urn%3Ali%3AgroupPost%3A2153908-7315427778760183808
🚨 Moody’s Shakes_Up_Credit_Ratings: The Green_Penalty & Reward_Effect!♻
With #$1.6T+ in ESG-linked financing, Moody’s is redefining creditworthiness, rewarding sustainability leaders & penalizing ESG laggards. 📉🚀 Companies failing on climate, social, & governance metrics are seeing their ratings cut—raising borrowing costs & investor risks.
📊 Companies Hit by Moody’s ESG_Based_Credit_Rating Adjustments
🟥 Nissan Motors – Downgraded 🚨
📌 Moody’s cut Nissan to junk due to weak sustainability integration & financial instability. (Source)
🟥 PG&E – Downgraded 🚨
📌 #$30B in wildfire liabilities led Moody’s to downgrade PG&E, linking climate risk to creditworthiness.
🟩 Royal Philips – Upgraded 🚀
📌 Green loan secured with ESG-linked interest rates, rewarding sustainability progress.
🟥 Thames Water – Downgraded 🚨
📌 Environmental violations & debt risks slashed its credit rating, as S&P flagged financial instability.
🟩 Casino Guichard-Perrachon – Upgraded 🚀
📌 Secured sustainability-linked loans, reducing interest rates based on ESG performance.
🟥 Enbridge – Downgraded 🚨
📌 Despite green loans, Moody’s questioned its carbon-heavy projects, impacting its rating.
🟩 Unibail-Rodamco-Westfield – Upgraded 🚀
📌 Green finance unlocked better credit conditions via ESG-tied loans.
🟥 Avangrid Gas Subsidiaries – Downgraded 🚨
📌 Regulatory ESG concerns lowered its credit ratings, citing fossil fuel dependency.
🟩 Drax Group – Under Review 🔍
📌 Sustainability-linked loans triggered scrutiny over carbon intensity goals.
🟥 Southern Water – Downgraded 🚨
📌 Environmental fines & governance risks led Moody’s to cut its credit rating.
🔥 The Takeaway: Moody’s Is Now Pricing in Sustainability Risks
🟢 17% of Moody’s rated firms see ESG risks impact their credit scores.
🟢 Companies with poor sustainability scores pay up to 15% higher borrowing costs.
🟢 Sustainability-linked finance = Lower interest rates & stronger credit ratings.
📢 Is this the wake-up call for businesses ignoring ESG? Let’s discuss below! 👇

Originally published on LinkedIn on 2025-02-27 12:45:56: https://www.linkedin.com/feed/update/urn%3Ali%3AgroupPost%3A82951-7300858693879799809
🚨 Moody’s & Sustainability: ESG is Now a Credit Rating Factor! 📊💚
With #$40T in ESG assets under management, Moody’s is reshaping how financial markets assess creditworthiness. No longer just about profits & losses, a company’s sustainability risks now directly impact credit ratings, borrowing costs, & investment potential.
🔍 How Moody’s Integrates Sustainability into Credit Ratings
🟢 ESG factors impact the credit ratings of 18% of companies & governments rated by Moody’s. (Source)
📊 Issuer Profile Scores (IPS): Measures 15 ESG subfactors (climate risk, governance strength, social responsibility).
📊 Credit Impact Scores (CIS): Rates how ESG performance affects a company’s credit rating & risk profile.
📊 Second Party Opinions (SPOs): Validates Green Bonds & Sustainability-Linked Loans, ensuring funds are climate-aligned.
🔹 Moody’s now assesses over 3,000 entities based on ESG factors.
💰 ESG & Financial Impact: Why Credit Ratings Depend on Sustainability
🏦 Banks & Investors Are Watching
📌 Companies with poor ESG ratings face higher borrowing costs, as investors demand sustainability-linked loans & bonds.
📉 Carbon-Intensive Companies Are High-Risk
📌 Firms with high Scope 3 emissions face 15-20% valuation risks due to carbon pricing & regulatory changes. (Source)
🚀 Sustainability-Linked Bonds & Loans Are Surging
📌 #$1.6T in sustainability-linked bonds & loans have been issued, with Moody’s validating green claims to prevent greenwashing. (Source)
🌍 Moody’s ESG Leadership: Recognitions & Market Influence
🏆 FTSE4Good Index Inclusion (6 Years Running) → Recognizing top ESG performers.
🏆 EcoVadis Bronze Medal → Top 35% of global companies for sustainability.
🏆 CDP Supplier Engagement Leader → Among the top 4% of companies driving supply chain decarbonization. (Source)
🔥 The Takeaway: Sustainability is No Longer Optional
🟢 18% of Moody’s rated companies now have ESG-driven credit adjustments.
🟢 Investors demand transparent sustainability metrics before lending.
🟢 Greenwashing is no longer profitable—credit ratings now hold companies accountable.
📢 Should ESG be an even bigger factor in credit ratings? Let’s discuss below! 👇

Originally published on LinkedIn on 2025-02-27 04:39:26: https://www.linkedin.com/feed/update/urn%3Ali%3AgroupPost%3A82951-7300736262829711360
NamasteCarbonPricingIndia:
The_State_of_Carbon_Pricing_2024: Progress, Disparities, and Where India Fits
The YR2024 State and Trends of Carbon Pricing Report highlights both progress and challenges in global carbon pricing as governments strive to meet the Paris Agreement’s goals. With 75 carbon pricing instruments now operational—39 carbon taxes and 36 emissions trading systems (ETSs)—the landscape is evolving, yet significant gaps in pricing levels and emissions coverage remain.
Global Carbon Pricing: The Leaders
Countries exceeding the $80-$100/ton threshold, recommended to limit global warming, are setting the benchmark:
Uruguay: $167/ton – The world leader, powered by its renewable energy dominance.
Switzerland: $132/ton – Among Europe’s most ambitious nations.
Sweden: $127/ton – Achieved a 33% emissions reduction since 1991.
Norway: $108/ton – Balances oil exports with green innovation.
These leaders leverage carbon pricing to fund renewables, incentivize green practices, and drive significant emissions reductions.
Falling_Short: Countries Below $40/ton
Despite the expanding reach of carbon pricing, many nations are still underpricing emissions, limiting their impact:
California (USA): $39/ton – Gradual cap-and-trade implementation.
Japan (Tokyo): $37/ton – Focused on innovation but still below target.
India: $5/ton – A coal cess aimed at balancing affordability and emissions reductions.
Currently, only 23% of global emissions are covered by these instruments, leaving significant gaps in global climate action.
Where India Stands
As the third-largest emitter globally, India represents a critical player in the future of carbon pricing:
$5/ton Carbon Price: Through its coal cess, generating $3 billion annually for renewable energy initiatives.
National Carbon Market: Launched in 2023 to facilitate voluntary carbon trading, with potential for scaling.
500 GW Renewable Energy Target: India is undergoing one of the world’s fastest energy transitions, underscoring its commitment to sustainability.
Carbon Credit Leader: Indian projects dominate voluntary markets, showcasing the country’s capacity to innovate in carbon offsets.
India’s current pricing is modest but represents a foundation for growth. By gradually scaling its carbon price and expanding the carbon market, India can harmonize economic growth with climate goals.
The Way Forward
Carbon pricing is a powerful tool, but the global average remains far below the $80-$100/ton threshold needed to limit warming to 1.5°C. For nations like India, leveraging mechanisms such as renewable energy investments, carbon markets, and circular economy practices can drive impactful change while balancing affordability and growth.
Originally published on LinkedIn on 2024-12-19 20:26:43: https://www.linkedin.com/feed/update/urn%3Ali%3AgroupPost%3A59930-7275607502493278209
NamasteIndia Carbon Pricing the Future: India’s Quest for an Economical Climate Change
To address India’s sector-specific challenges in carbon pricing, a multi-faceted approach is necessary. For sectors like heavy industry and agriculture, which are difficult to decarbonize, targeted subsidies, technological innovation, and capacity-building initiatives could ease the transition. Additionally, the private sector’s proactive role and policy coherence are crucial for adapting the carbon pricing model to India’s unique context.
Alternatives to a comprehensive carbon pricing system include regulatory measures, subsidies for low-carbon technologies, and voluntary carbon markets. These can complement carbon pricing by addressing market failures and incentivizing green investments.
Globally, there are successful examples of carbon pricing systems. Sweden, for instance, has a robust carbon tax that has led to significant emissions reductions while the economy grew. The EU’s Emissions Trading System (ETS) is another example, demonstrating how cap-and-trade can effectively lower emissions across member states.
India can learn from these models, tailoring them to its own economic and environmental contexts to ensure a just and equitable transition towards a sustainable future.
Charting Pathways for India’s Carbon Market https://lnkd.in/drtHNkEf
Originally published on LinkedIn on 2024-06-12 11:48:04: https://www.linkedin.com/feed/update/urn%3Ali%3Ashare%3A7206623286598807554

