KtalystFuelFlex Series 101:
The Macroeconomic Reality of Fuel Contamination
Fuel Flex is often misread as petty adulteration or local distributor malpractice.
That framing is no longer sufficient.
Modern fuel fraud operates as a systemic mechanism of fiscal leakage, subsidy capture, market distortion and climate-accounting failure. It weakens sovereign tax bases, diverts public incentives, penalizes legitimate market participants and puts green-transition credibility at risk.
The damage sits across four economic vectors:
1. Fiscal Leakage
Liquid fuels are high-volume, high-tax commodities. When untaxed or lower-taxed products are blended into commercial fuel streams, the state loses core fiscal yield. SARS estimates fuel adulteration drains approximately R3.6 billion annually from South Africa’s national fiscus.
2. Subsidy Capture
In green fuel markets, weak verification can turn policy support into an extraction mechanism. In the Washakie Renewable Energy case, a coordinated conspiracy generated $1.16 billion in fraudulent biofuel tax credits and extracted $511 million in IRS cash payouts.
3. Market Capture
Fraudulent or weakly verified supply creates artificial cost advantage. Under the U.S. Renewable Fuel Standard, the EPA Office of Inspector General identified nearly 339 million fraudulent RINs, linked to $87 million in illicit transactions. Ghost compliance supply dilutes legitimate credit value and undermines genuine producers.
The risk is also visible in global feedstock flows. Reuters reported that Chinese used cooking oil imports into the U.S. surged from under 200 million pounds per year to over 3 billion pounds in 2023, raising concerns around origin fraud, subsidy eligibility and domestic feedstock displacement.
4. Climate Distortion
The deepest risk is not only economic. It is atmospheric.
When fossil or high-emission pathways are misdeclared as renewable, carbon ledgers become unreliable. The European Commission’s 2025 review of Chinese biodiesel fraud allegations did not confirm intent to defraud, but it did identify systemic weaknesses in supply-chain certification audits.
That matters.
Because if the audit system cannot guarantee traceability, climate accounting becomes fragile.
The conclusion is simple:
Fuel fraud is not leakage.
It is economic extraction through weak authentication.
This is why the sector must move beyond asking:
Is the fuel marked?
The better question is:
Can the molecule, feedstock, custody route, carbon claim and money trail be independently authenticated?
Marked is not enough.
Certified is not enough.
Authenticated is the new minimum.
Dr. Anju Sharma
Originally published on LinkedIn on 2026-06-24 16:41:21: https://www.linkedin.com/feed/update/urn%3Ali%3Ashare%3A7475588889861214208
KtalystGreyToGreen: Shipping partner that strengthens your carbon credits, not your carbon liability.
Dr. Anju Sharma MrsSustainability
Scale built the old maritime advantage.
Scale minus carbon is building the new one.
EU ETS surrender obligations rise to 70% in 2026, after 40% in 2025, and move to 100% from 2027 onward for covered shipping emissions. Coverage already includes CO₂ and expands to CH₄ and N₂O from 2026. Carbon has moved from sustainability language to operating cost.
More than 80% of world trade by volume moves by sea. Shipping therefore sits at the center of a new commercial equation: freight rate, fuel choice, compliance cost, and carbon exposure now travel together.
1. Carbon has entered freight math
✓ EU ETS now applies to large ships of 5,000 GT and above calling at EU ports.
✓ Compliance rises in stages: 40% → 70% → 100%.
✓ Methane and nitrous oxide enter the system from 2026.
Shipping is no longer managing only fuel bills. Shipping is now managing carbon bills too.
2. Fuel choice has become strategy
✓ FuelEU Maritime is pushing demand toward renewable and low-carbon fuels.
✓ Zero-emission technology at berth is part of the transition logic.
✓ Fleet relevance now depends on fuel optionality, not only vessel size.
3. Global direction is already set
✓ IMO’s 2023 GHG Strategy calls for at least a 40% reduction in carbon intensity by 2030.
✓ IMO also targets at least 5%, striving for 10%, uptake of zero- or near-zero-GHG fuels, technologies, and energy sources by 2030.
✓ Ships above 5,000 GT account for about 85% of international shipping GHG emissions, which is why regulation is focusing there.
4. Market leaders are already shaping the curve
Public Alphaliner data continues to place MSC, Maersk, CMA CGM, COSCO, and Hapag-Lloyd among the leading global liner operators. Fleet decisions by these carriers influence fuel pathways, ordering logic, and competitive benchmarks across the sector.
5. The Value edge is changing
Old shipping advantage: scale.
New shipping advantage: scale with lower carbon liability.
That means:
✓ lower ETS exposure
✓ better fuel optionality
✓ cleaner freight propositions for Scope 3-conscious customers
✓ stronger long-term asset relevance under tighter regulation
KtalystKlues™
A ship is no longer judged only by what it carries. A ship is increasingly judged by what it burns, emits, and leaves behind.
The voyage is the same.
The value equation is not.
Abrivations: TEU = twenty-foot equivalent unit | DWT = deadweight tonnage | EU ETS = European Union Emissions Trading System | IMO = International Maritime Organization | GHG = greenhouse gas | GT = gross tonnage | CO₂ = carbon dioxide | CH₄ = methane | N₂O = nitrous oxide
KtalystMarineGreens KtalystValueEdge KtalystGreyToGreen KtalystInsights™ KtalystKlues™ MrsSustainability
Originally published on LinkedIn on 2026-04-22 08:52:52: https://www.linkedin.com/feed/update/urn%3Ali%3Ashare%3A7452640558793240576
NamasteIndia 🚀
Framework_to_Future: India’s CCTS – A Data-Driven Power Play
YR2023–YR2025) 📊
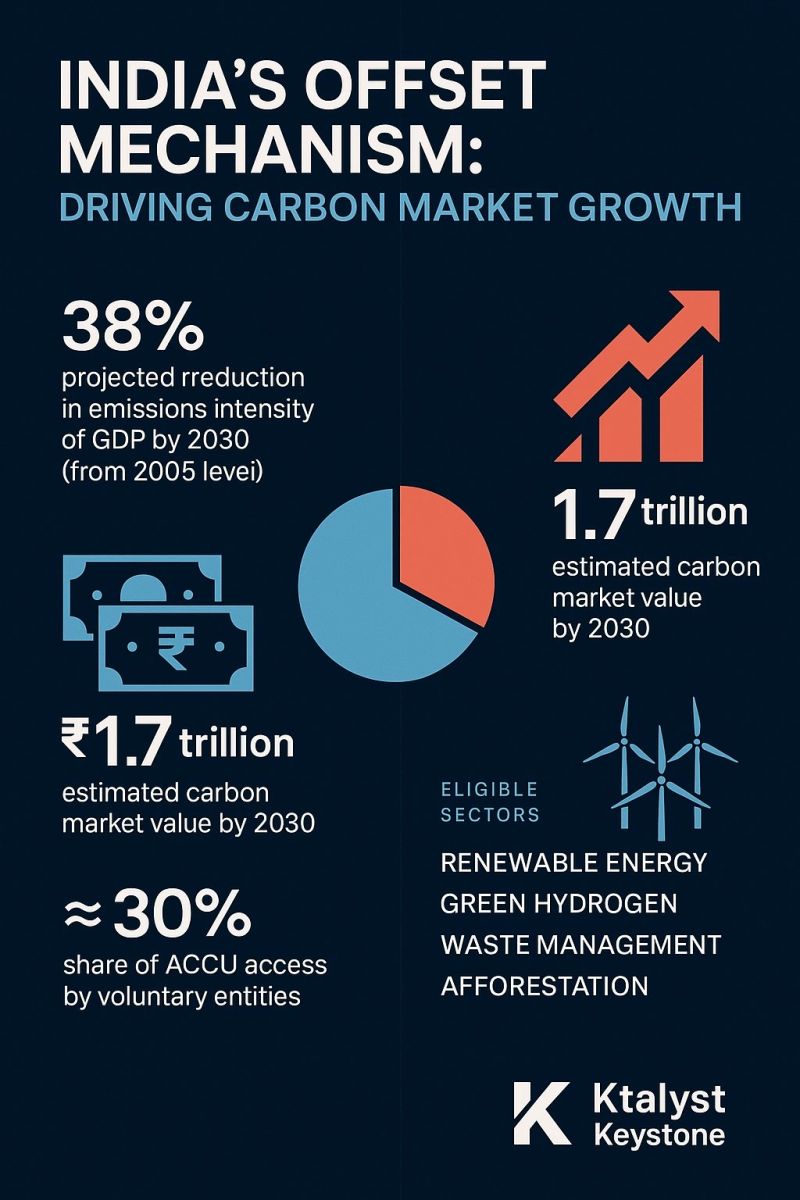
India’s Carbon Credit Trading Scheme (CCTS) has rapidly transformed from a policy blueprint to a dynamic market. Here’s a concise, data-rich overview of its evolution:
YR2023: 🏗️ Foundation Laid
June2023: 📜 Government notifies CCTS, establishing a Compliance Mechanism.
* 🎯 Objective: Reduce GHG intensity in key sectors.
* 🏭 Sectors: Cement, Steel, Aluminium, Refineries, etc.
* ⚖️ Legal: Energy Conservation (Amendment) Act, 2022.
* 🏛️ Regulators: BEE, CERC.
YR2024: 📐 Architecture Built
* Dec2023: 🔄 Offset Mechanism integrated.
* 🌱 Key: Non-obligated entities can develop projects.
* 💳 CCCs: Tradable Carbon Credit Certificates.
* 🌍 Alignment: Paris Agreement’s Article 6.
* ✅ ACVAs: Validation & Verification agencies established.
* 🖥️ ICM: Indian Carbon Market registry conceptualized.
YR2025: 📈 Market Activated
* March2025: 8️⃣ Methodologies approved:
* ⚡ Renewable Energy
* 💧 Green Hydrogen
* 🏭 Industrial Efficiency
* 🗑️ Landfill Methane
* 🌳 Mangrove Afforestation
* 💰 Market Potential: USD 300 billion by 2030.
* 🌐 Global Projection: IETA: USD 1-1.5 trillion by 2050.
* 🤝 Transition: PAT scheme integration; full compliance by mid-2026.
Quote:
India’s carbon market is not just compliance—it’s climate economics in motion.” — Anju Sharma, MD, Ktalyst Keystone.
Future: 🔮 Innovation & Integration
* 💻 Digital Infrastructure: For Carbon Credits.
* 🤝 Global Links: International Carbon Market integration.
* 📊 Scope 3 & MRV: Standards inclusion.
* 💡 Private Sector: Tech & Nature-Based solutions.
Call_to_Action:
Let’s discuss how your organization can leverage India’s evolving carbon market. Connect with me!
Question:
How will CCTS reshape your industry? Share your insights!
Hashtags:
CarbonCredits IndiaCarbonMarket CCTS ClimateAction Sustainability EnergyTransition GreenEconomy EnvironmentalPolicy ParisAgreement ESG CleanEnergy Innovation DataDriven MarketInsights


Originally published on LinkedIn on 2025-04-07 17:18:44: https://www.linkedin.com/feed/update/urn%3Ali%3AugcPost%3A7315060472787955712
When_Everything_Falls, GoldRises – The Gold Signal You Can’t Ignore
What if your portfolio could whisper before the market shouts?
While headlines chase tech meltdowns and tariff tremors, one asset has moved with quiet certainty: Gold.
Gold’s rise isn’t just expected—it’s essential:
First_to_React, Last_to_Collapse
In 2008, S&P 500: –38% | Gold: +5.5%
In March 2020 (COVID crash), gold peaked at $2,063/oz
Gold doesn’t wait for recovery—it kickstarts it.
TheCurrencyof_Panic & Policy Failure
2022 U.S. Inflation: 9.1%
Gold: back above $2,000/oz
Gold holds value when paper loses memory.
Exit_Strategy for the SmartMoney
Daily gold trading volume: $145B+, rivaling U.S. Treasuries
In chaos, liquidity isn’t optional—it’s king. Gold delivers.
Fear_Has_a_Price—and It’s Rising
After Russia-Ukraine began (Feb 2022), gold surged 13% in 30 days
Sentiment trades faster than spreadsheets. Gold is emotion monetized.
CentralBanks Aren’t Buying Headlines—They’re Buying Gold
2023: Central banks acquired 1,136 tonnes – a historic record
China, India, Turkey leading the shift
This isn’t hedging. This is repositioning for a new monetary map.
Bottom Line:
Gold doesn’t follow markets. It follows meaning. And right now, it’s screaming certainty in an uncertain world.
KTALYSTKEYSTONE
KtalystIntel | Gold2025 | SafeHavenAssets | MonetarySignals | BoardroomWatch

Originally published on LinkedIn on 2025-04-03 12:52:04: https://www.linkedin.com/feed/update/urn%3Ali%3Ashare%3A7313543814126698497
BoardroomMandate: Sustainability is No Longer Optional—It’s an IndustryImperative
#📌 The Industry Wake-Up Call: Sustainability as a Business Mandate
#📉 $4 Trillion at Risk – Non-compliant companies risk market value erosion, fines, and investor exits.
#📈 68% of Institutional Investors – ESG performance now directly influences capital allocation.
#🔎 Regulatory Overhaul – EU CSRD, SEC Climate Disclosures, India’s BRSR mandate sustainability reporting.
#🌍 Sustainability Metrics by Industry
#🌾 Agriculture
✅ AI-backed precision farming → 15% fuel savings | 30% lower pesticide & water use | 20% higher yield #
#👗 Fashion & Textiles
✅ India targets $350B industry by 2030 while cutting emissions by 50% #
✅ Biomass & renewable energy adoption reducing carbon footprint #
#📢 Advertising & Marketing
✅ 25% rise in consumer trust for brands with authentic sustainability efforts #
❌ Greenwashing crackdown – Firms face legal & reputational damage #
#🛍 Retail & Consumer Goods
✅ 65% of consumers prefer brands with strong sustainability credentials #
✅ Sustainable businesses see higher long-term revenue growth #
#🧪 Biotech & Materials Science
✅ Seaweed-based biomaterials emerging as a sustainable alternative to plastics #
#📊 ESG Data & Risk Analytics
✅ 70% of Fortune 500 firms use ESG risk monitoring tools to ensure compliance & risk mitigation #
#💼 Corporate Sustainability Rankings
✅ Top 10% sustainable companies outperform market peers by 7% TSR #
#📌 What Boards Need to Do—Now
✅ Embed ESG in Growth Plans – Not a side initiative, but a core strategy #
✅ Ensure Regulatory Compliance – Align with global ESG mandates #
✅ Set Industry-Specific KPIs – Track & measure sustainability performance #
✅ Invest in Low-Carbon Innovation – AI, renewables, & circular economy #
✅ Demand Transparent ESG Reporting – Investor & regulatory trust is at stake #
📢 Board Directors: Is your company’s ESG strategy future-ready? Let’s discuss. 👇 #


Originally published on LinkedIn on 2025-03-11 16:22:38: https://www.linkedin.com/feed/update/urn%3Ali%3AgroupPost%3A4385073-7305261883983355904
🚗⚡ EV KnowledgeSeries – Global_Perspective
🔋 What is an EV?
🔹 Uses electric motors for propulsion, reducing fossil fuel dependency.
🔹 Lowers carbon footprint, improves energy efficiency.
🔌 Types of EVs
🔋 BEVs: Fully electric, no fuel. ⚡ Tesla Model 3, Nissan Leaf
🔋 HEVs: Fuel + electric motor, self-charging. 🚗 Toyota Prius, Honda City e:HEV
🔋 PHEVs: Can be externally charged + fuel engine. 🔌 BMW 330e, Mitsubishi Outlander PHEV
🔋 FCEVs: Hydrogen fuel cell-powered. 💧 Toyota Mirai, Hyundai Nexo
📈 Global EV Market Trends
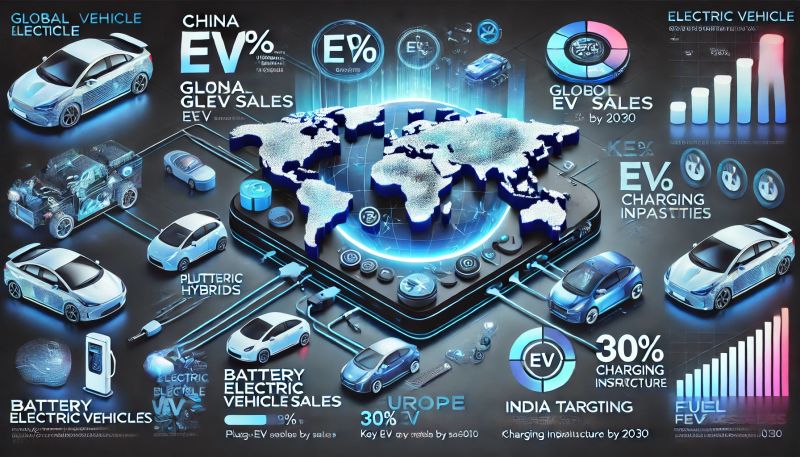
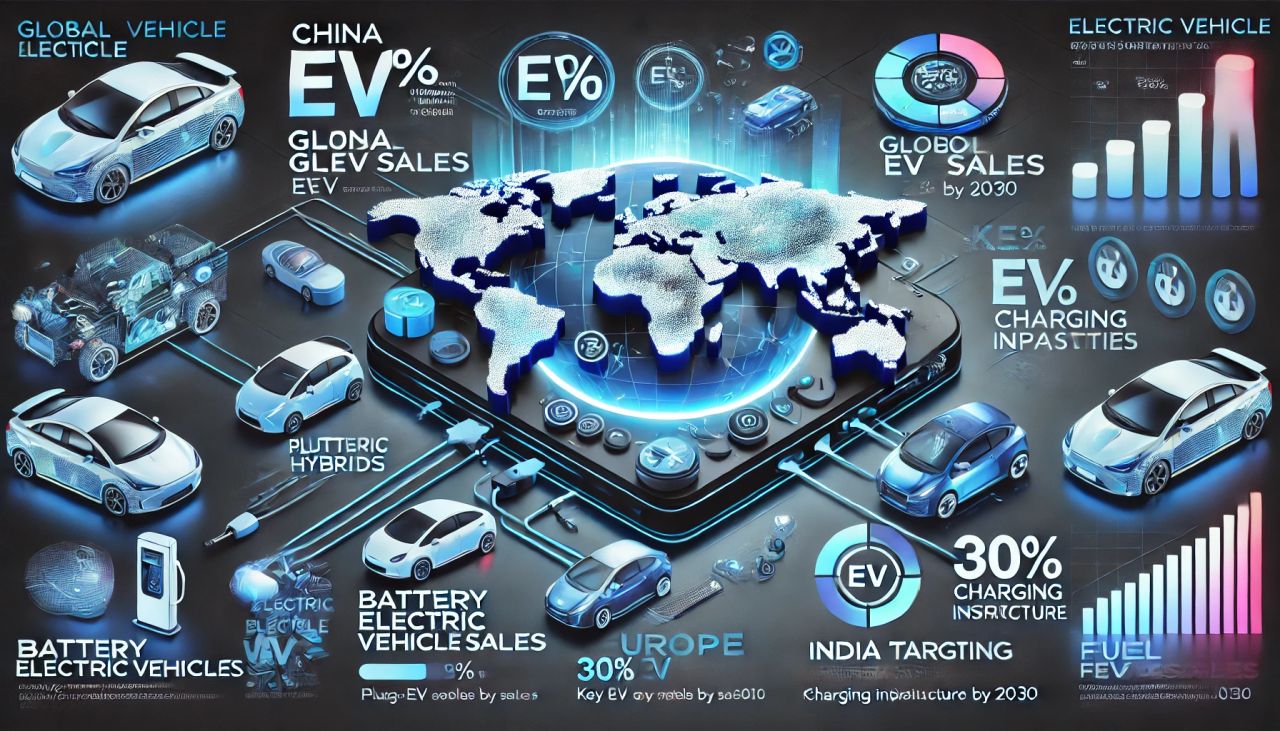
🔹 #🌍 Market Share (2024)
🔋 China: 🇨🇳 60% global EV sales.
🔋 Europe: 🇪🇺 30%+ EV adoption, Norway 80% EV sales.
🔋 USA: 🇺🇸 Rapid Tesla-led expansion.
🔋 India: 🇮🇳 5% market share, 30% target by 2030.
🔹 #🚘 Top EV Brands (2024)
🔋 #🥇 BYD (China) – 3.0M units.
🔋 #🥈 Tesla (USA) – 2.5M units.
🔋 #🥉 Volkswagen (Germany) – 1.5M units.
🔋 #🏅 Hyundai-Kia (Korea) – 1.2M units.
🔋 #🎖 Tata Motors (India) – 200K units.
⚡ EV Charging Infrastructure
🔹 #🚀 Charging Types
🔋 AC Slow Charging: ⏳ 6-12 hours (home, public).
🔋 DC Fast Charging: ⚡ 30-60 mins (public stations).
🔋 Ultra-Fast Charging: 🚀 <15 mins (Tesla Superchargers).
🔹 #🌍 Global Charging Stats
🔋 China: 🇨🇳 5M+ chargers (largest).
🔋 Europe: 🇪🇺 2.5M+ chargers.
🔋 USA: 🇺🇸 800K+ chargers.
🔋 India: 🇮🇳 10K+ chargers, 1M target by 2030.
🏛 Government Policies & Incentives
🔹 #💰 EV Incentives (2024)
🔋 #🇺🇸 USA: $7,500 tax credit.
🔋 #🇨🇳 China: Subsidies + free EV license plates.
🔋 #🇪🇺 EU: CO₂ limits, ICE ban 2035.
🔋 #🇮🇳 India: FAME-II, 5% GST, state subsidies.
🔹 #🚫 Emission Regulations
🔋 EU: ICE ban by 2035.
🔋 California: 100% ZEVs by 2035.
🔋 China: 40% EV target by 2030.
🚧 EV Challenges & Solutions
🔹 #⚠️ Challenges
🔋 Battery Cost & Supply – Lithium shortage.
🔋 Charging Infra – Insufficient fast chargers.
🔋 Range Anxiety – Fear of running out of charge.
🔋 High Cost – EVs costlier than ICE cars.
🔋 Grid Strain – Rising power demand.
🔹 #💡 Solutions
🔋 #✅ Battery Innovation – Solid-state tech.
🔋 #✅ Faster Charging – Ultra-fast networks.
🔋 #✅ Policy Push – More subsidies & infra funding.
🔮 Future of EVs – What’s Next?
🔹 #📌 2030+ Predictions
🔋 #🔹 EVs = 40-50% of new sales.
🔋 #🔹 50% cheaper batteries.
🔋 #🔹 Hydrogen FCEVs for trucking.
🔋 #🔹 V2G tech: EVs power grids.
🔋 #🔹 Solar-powered EVs.
🚀 TheEVRevolutionIsNow SustainableMobility TheFutureIsElectric
Originally published on LinkedIn on 2025-03-10 13:29:07: https://www.linkedin.com/feed/update/urn%3Ali%3Ashare%3A7304855827301961729
KnowledgeSeries: The Future of CarbonCredits – A USD250B Market by 2050
The carboncredit market is no longer a side conversation—it’s becoming a mainstream financial instrument. With projections hitting #$250B by 2050, businesses and investors must pay attention.
Why? Because companies that integrate NetZero strategies today will gain a competitive edge, while those that don’t will face higher costs, regulatory risks, and shrinking investor confidence.
🌎 The Carbon Credit Boom: Why It’s a Business Imperative
✔️ The voluntary carbon market is set to grow 15X by 2030, reaching #$10B–$40B. (McKinsey)
✔️ Investments in carbon credits hit #$1.7B in 2023, up 50% YoY. (BloombergNEF)
✔️ 6,000+ global companies have set Science-Based Targets (SBTi), driving demand for verified carbon offsets.
✔️ Indonesia, Brazil, and Kenya are integrating carbon markets into their economies, generating revenue from forests, renewable energy, and carbon capture projects.
✔️ Article 6 of the ParisAgreement is enabling international carbon credit trading, boosting market credibility.
🚀 What does this mean for businesses?
✔️ A carbon credit strategy is no longer optional—it’s a business necessity.
✔️ Companies without a decarbonization plan will face higher compliance costs.
✔️ Investors are prioritizing NetZero leaders, making carbon credits a key ESG performance driver.
📊 Who’s Leading the Carbon Credit Race?
✔️ Big Tech & Carbon Capture:
Meta, Microsoft, and Google are securing multi-million-dollar deals in Direct Air Capture (DAC) to future-proof their carbon strategies.
✔️ Financial Institutions Going Green:
BlackRock, JP Morgan, and Goldman Sachs are launching climate-focused funds, treating carbon credits as an emerging asset class.
✔️ Corporate Adoption Soaring:
40%+ of Fortune500 companies are embedding carbon offsets into their business models.
✔️ Government-Led Action:
The EU, Singapore, and Japan are developing regulated carbon exchanges to ensure transparency & standardization.
🌱 What to Expect in 2025 & Beyond?
✔️ Stricter Regulations → Carbon credit verification will be tighter, reducing low-quality offsets & greenwashing risks.
✔️ Rising Prices → As demand outstrips supply, carbon credit prices could triple by 2030, making early adoption a smart financial move.
✔️ Emerging Markets in Play → Africa, Southeast Asia, and Latin America will dominate nature-based carbon solutions (reforestation, soil carbon, etc.).
✔️ Carbon as a Tradable Asset → Institutional investors are pushing for liquid carbon credit markets, making carbon a financialized commodity.
🔍 ComingUpNext: “The Business Case for Carbon Credits – Risks, Rewards & Strategy
Originally published on LinkedIn on 2025-03-08 07:02:05: https://www.linkedin.com/feed/update/urn%3Ali%3AgroupPost%3A82951-7304033651044839424
KnowledgeSeries – Decoding Carbon Credits: Which Ones Truly Make an Impact?
Carbon credits are essential tools in the fight against climate change, but not all credits are created equal. Here’s a quick guide to understanding their types and impact.
🌍 Compliance Carbon Credits
✅ Regulated Offsets – Mandatory under government-led carbon markets.
✅ Examples: EU ETS, California Cap-and-Trade, China ETS.
✅ Who Uses Them? Heavy industries, power plants, airlines, and corporations with emission limits.
💡 Voluntary Carbon Credits
✅ Market-Driven Offsets – Purchased by businesses and individuals to meet sustainability goals.
✅ Examples: Renewable Energy Credits (RECs), Forestry & Land Use, Methane Capture.
✅ Who Uses Them? Airlines, event organizers, eco-conscious brands.
🌱 Nature-Based Carbon Credits
✅ Carbon Sequestration – Uses ecosystems to absorb CO₂.
✅ Examples: Reforestation, Blue Carbon (Mangroves & Seagrass), Soil Carbon Farming.
✅ Why It Matters? Restores biodiversity, improves water cycles, and benefits local communities.
🔬 Technology-Based Carbon Credits
✅ Innovative Carbon Removal – Uses advanced tech to pull carbon from the air.
✅ Examples: Direct Air Capture (DAC), Carbon Capture & Storage (CCS), Waste-to-Energy.
✅ Challenges: High cost, scalability, and energy consumption.
⚡ Avoidance & Reduction Credits
✅ Preventing Emissions at the Source – Focuses on eliminating carbon before it’s released.
✅ Examples: Wind & Solar Energy, Energy Efficiency, Clean Cooking Stoves.
✅ Why It’s Crucial? Immediate impact with proven effectiveness.
🤝 Social Carbon Credits
✅ Climate + Community Benefits – Supports sustainability while improving lives.
✅ Examples: Sustainable Farming, Water Purification, Community Reforestation.
✅ Beyond Carbon? Jobs, education, and health improvements.
🔥 Biochar Carbon Credits
✅ Long-Term Carbon Storage – Converts biomass into stable carbon that remains in the soil.
✅ Benefits: Boosts soil health, prevents methane release, locks carbon for centuries.
✅ The Future? High permanence with agricultural benefits.
Which Carbon Credit Makes the Most Impact?
✅ Compliance Credits – Necessary but market-dependent.
✅ Voluntary Credits – Flexible, but risk of greenwashing.
✅ Nature-Based – Cost-effective and high-impact.
✅ Tech-Based – Promising, but expensive.
✅ Avoidance & Social Credits – Immediate reductions with co-benefits.
✅ Biochar – One of the most durable carbon storage solutions.
💬 Which one do you think has the highest potential for a net-zero future? Comment below!
Sustainability CarbonMarkets NetZero ClimateAction
Originally published on LinkedIn on 2025-03-06 08:05:21: https://www.linkedin.com/feed/update/urn%3Ali%3AgroupPost%3A100646-7303324797692747776
TheCircularEconomyBoom
📊 Market Growth: $339B → $712B (2030)
🛍 Key Sectors: ♻️ Recycling | 📦 Packaging | ⚡ Waste-to-Energy | 👕 Textile Circularity
💰 Big Investors: BlackRock | Goldman Sachs | Breakthrough Energy
Circular Economy vs. Traditional Returns
📈 ROI (5-year average):
🟢 Circular Economy: 8-12% CAGR
🔴 Traditional Markets: 5-7% CAGR
⚡ Waste-to-Energy IRR: 10-15% (Beats traditional waste management)
🛍 Consumer Trend: 73% willing to pay more for sustainability
VC & PrivateEquity Betting Big
🌎 Global Funding: $75B+ in Circular Startups
💰 Top-Funded Startups:
🔋 Northvolt – Battery Recycling
♻️ Loop Industries – Plastic Circularity
📦 Zume – Biodegradable Packaging
🚀 Major Investors: Sequoia | KKR | TPG Rise
Policy Tailwinds Driving Investments
📜 Global Incentives:
🇪🇺 EU Green Deal: €1T Sustainability Fund
🇺🇸 IRA: $370B in Climate Incentives
🇨🇳 China 5-Year Plan: $460B Circular Infra
📊 Policy-Driven Sectors: ⚡ EV Battery Recycling | 🔄 Industrial Waste Upcycling | 🌍 Carbon Markets
Circular Business Models Winning Capital
📊 High-Growth Revenue Models:
🔄 Product-as-a-Service (PaaS): 15-20% YoY
♻️ Recommerce & Reverse Logistics: 12-18% YoY
🌱 Upcycling & Material Innovation: 10-15% YoY
📌 Investment Hotspots:
🔹 Asia-Pacific – Fastest-Growing 🌏
🔹 Europe – Corporate Circular Leaders 🇪🇺
🔹 North America – VC & PE Capital Hub 💰
Impact Metrics Investors Track
📊 Data-Driven KPIs:
♻️ Material Recovery Rate – % Waste Reused
💰 Resource Productivity – GDP/kg Material
🌍 CO₂ Reduction Impact – Carbon Saved/$
📈 RoSI – Return on Sustainability Investment
🚀 Tech Game-Changers: AI & Blockchain in Circular Supply Chains
Future of Circular Investing (2025-2030)
🔮 Market Outlook:
📊 $4.5T+ Circular Economy by 2030
📈 VC/PE Capital to 3x by 2028
🔥 Fastest-Growing Sectors:
🏗 Circular Construction 💰 $500B+
⚡ Green Hydrogen 💰 $600B+
🧠 AI-Driven Waste Mgmt 💰 $100B+
🌍 InvestForImpact – High returns meet sustainability. 💰♻️
💬 Which sector interests you most? Drop a comment!
CircularEconomy ImpactInvesting SustainableFinance ClimateInvestment
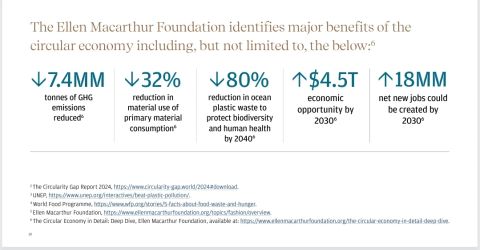
Originally published on LinkedIn on 2025-03-05 14:01:17: https://www.linkedin.com/feed/update/urn%3Ali%3Ashare%3A7303051986592014336
🚨 India’s EVRegulations 2025: What’s New & What It Means for the Industry? ⚡🚗
With EV sales in India growing 49% YoY, new regulatory shifts are shaping the future of the sector. The latest policies focus on local manufacturing, safety standards, & market expansion while setting new rules for charging infrastructure & import incentives. Here’s what’s changing:
📊 Key EV Policy Updates & Their Impact
🔹 Investment Caps on Charging Infrastructure
📌 The Indian Government now limits EV manufacturers to count only 5% of their total investment in charging networks toward the #$500M minimum investment required for lower import tariffs.
📌 Why It Matters? This ensures priority to local EV production, reducing reliance on imports. (Source)
🔹 Tesla’s Entry & Market Implications
📌 Tesla is setting up showrooms in Mumbai & New Delhi and exploring local production. However, high import duties (up to 100%) could push Tesla’s pricing into the luxury segment, making affordability a challenge.
📌 EV Market Reality: The average car price in India is #$10,000-$15,000, while a Tesla Model 3 would cost over #$50,000 without local assembly. (Source)
🔹 Stricter Safety & Battery Standards
📌 BIS (Bureau of Indian Standards) introduces new EV safety rules, requiring all EVs to meet upgraded performance & fire safety benchmarks.
📌 Battery Regulation: EV battery makers must obtain AIS 156 certification from ARAI (Automotive Research Association of India) to ensure safety compliance.
📌 Why It Matters? India aims to reduce EV fire risks, ensuring consumer safety and boosting market confidence. (Source)
🔹 Union Budget 2024-25: EV Industry Boost
📌 Customs duty exemptions on 25 critical minerals used in EV battery production will lower manufacturing costs.
📌 PLI (Production-Linked Incentive) expansion aims to reduce import dependency & boost domestic production.
📌 FAME III (Faster Adoption & Manufacturing of Electric Vehicles) is expected to focus on charging infrastructure expansion. (Source)
⚡ The Takeaway: What’s Next for India’s EV Industry?
🚀 EV penetration in India is at 2% but projected to hit 30% by 2030.
🚀 Government policies favor local EV manufacturing over imports.
🚀 Safety & compliance measures will shape consumer trust & adoption.
📢 Will these new regulations accelerate India’s EV transition or slow global players like Tesla? Let’s discuss! 👇
Source / shared link: https://m.economictimes.com/industry/renewables/govt-set-to-notify-new-ev-policy-with-new-investment-rules-as-tesla-prepares-for-india-entry/articleshow/118415610.cms
Originally published on LinkedIn on 2025-02-27 06:19:45: https://www.linkedin.com/feed/update/urn%3Ali%3AgroupPost%3A82093-7300761508139974656

