📚 KnowledgeSeries: The Hidden_Cost_of_Digital_Pollution – Is the Internet Killing the Planet? 🌍💻
While we focus on EVs, renewables, & plastic waste, digital pollution remains an invisible climate threat. From emails to AI, the internet’s carbon footprint is bigger than expected.
📊 Digital Pollution: The Data Behind the Screens
🟢 Data Centers = 2% of Global Electricity Use → That’s more than Germany’s entire energy consumption. (Source)
🟢 One Email = 4g CO₂ → With attachments, it’s 50g CO₂. 306B emails/day = 15M tons of CO₂ annually.
🟢 Video Streaming = 1% of Global CO₂ → One hour of Netflix in HD = 36g CO₂ → Watching at lower resolution cuts emissions by 40%.
🟢 Google Searches Emit 500 Tons CO₂/Day → Each search = 0.2g CO₂. 8.5B searches daily = annual emissions of 1.3M cars.
🟢 AI & Cloud Computing Are Carbon Guzzlers → Training one AI model emits 125,000 lbs CO₂, equal to five cars’ lifetime emissions.
🛑 How to Reduce Digital Pollution?
🟢 Delete Unnecessary Emails → Reducing 100 unneeded emails = saving 30kg CO₂ annually.
🟢 Declutter Cloud Storage → 1GB of deleted cloud data = 7kg CO₂ saved per year.
🟢 Use Green Hosting → Only 30% of websites are on carbon-neutral servers.
🟢 Limit AI Queries → Reducing unnecessary AI prompts & computations cuts energy waste.
🔥 The Takeaway: Is Digital the New Plastic?
🟢 If the internet were a country, it would be the 6th largest polluter in the world.
🟢 Digital sustainability is the next frontier—will businesses take action?
🟢 Every click, search, and email has a carbon cost—time to rethink digital habits.
📢 How can we build a cleaner, low-carbon internet? Let’s discuss! 👇

Originally published on LinkedIn on 2025-03-03 14:43:53: https://www.linkedin.com/feed/update/urn%3Ali%3AgroupPost%3A82951-7302337927789879296
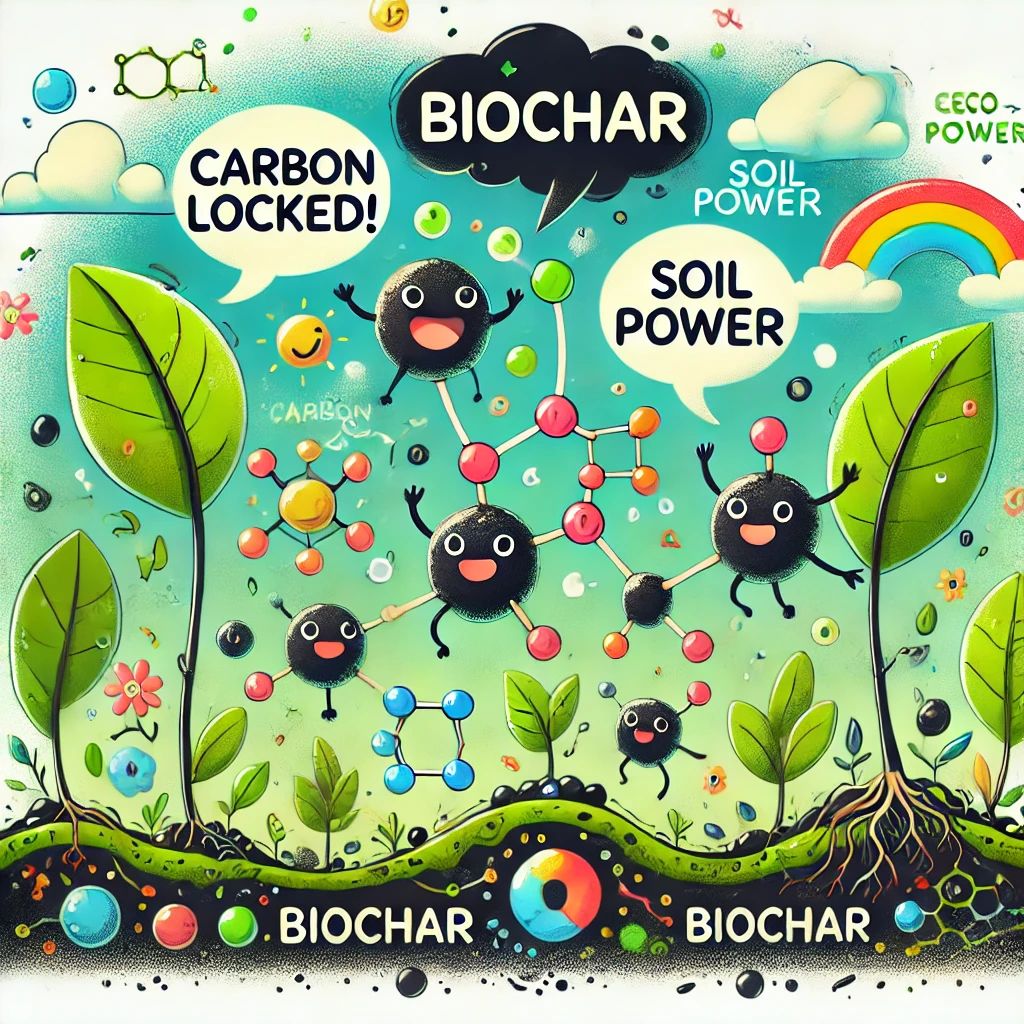
#️⃣ KnowledgeSeries | Biochar: The Silent Climate Solution 🌱🔥
🌍 Can_We_Lock_Carbon for Centuries While Boosting Soil? Yes—With Biochar!
📊 # Key Biochar Facts & Figures
📉 3Tons of CO₂ Sequestered Per Ton of Biochar – One of the most efficient carbon capture tools. (IPCC)
🌾 # 28% Increase in Crop Yields – Improves soil fertility and water retention. (Nature Communications)
💧 # 50% Less Nitrogen Runoff – Reduces water pollution from fertilizers. (Environmental Science & Technology)
♻ 3BillionUSD Market by 2030 – Growing at 13.2% CAGR, driven by climate policies. (MarketsandMarkets)
🏗 60% Lower Concrete Emissions – Biochar-infused cement is cutting industrial carbon footprints. (MIT Research)
🏭 # 90% Efficiency in Industrial Wastewater Treatment – Filters heavy metals & pollutants. (Journal of Environmental Management)
🔥 Who’s Investing?
💰 Microsoft & Shopify – Using biochar as verified carbon offsets.
🛍 IKEA & H&M – Researching biochar-infused textiles.
🚜 Indian & African Farmers – Improving soil health in degraded lands.
🏆 Biochar’s Future: From Farms to Factories
💡 Could biochar become a global standard in climate strategy? Drop your thoughts! 👇

Originally published on LinkedIn on 2025-03-02 15:37:10: https://www.linkedin.com/feed/update/urn%3Ali%3AgroupPost%3A2474261-7301988952033419264
NamasteYouthIndia
Leaving Carbon Footprints: Who’s the Bigfoot?
India, now the world’s most populous country with a median age of 28, boasts the largest youth demographic globally. Despite this, India’s per capita consumption and carbon footprint remain significantly lower than those of other major economies.
Food Consumption:
India:
Rural: 46% of household expenditure on food; approximately 2,081 kcal/day per capita.
Urban: 39% of household expenditure on food; approximately 1,943 kcal/day per capita.
UnitedStates: Approximately 3,800 kcal/day per capita.
China: Approximately 3,400 kcal/day per capita.
Europe: Approximately 3,400 kcal/day per capita.
Electricity Consumption:
India: 1,395 kWh/year per capita (2024), a 36% increase over 5 years.
UnitedStates: Approximately 12,000 kWh/year per capita, about 9 times India’s consumption.
China: Approximately 5,500 kWh/year per capita, about 4 times India’s consumption.
Europe: Approximately 5,800 kWh/year per capita.
Water Consumption:
India: 1,500 m³/year per capita, a 20% decline over two decades.
UnitedStates: Approximately 3,800 m³/year per capita.
China: Approximately 2,000 m³/year per capita.
Europe: 1,200–1,500 m³/year per capita.
Carbon Footprints:
India: 1.89 metric tons CO₂/year per capita.
United States: 14.21 metric tons CO₂/year per capita.
China: 8.89 metric tons CO₂/year per capita.
Europe: Approximately 5.8 metric tons CO₂/year per capita.
Highlights:
India: Despite having the largest and youngest population, India maintains the lowest per capita consumption and carbon footprint among major economies.
United States: Exhibits the highest per capita energy and water usage, resulting in a substantial carbon footprint.
China: Rapid industrial growth contributes to significant increases in consumption and emissions.
Europe: Demonstrates balanced consumption with moderate emissions and efficient resource utilization.
India’s disciplined consumption patterns amidst a burgeoning, youthful population underscore its commitment to sustainable growth.
Originally published on LinkedIn on 2024-12-05 14:35:38: https://www.linkedin.com/feed/update/urn%3Ali%3Ashare%3A7270445719734415361

