📚 KnowledgeSeries: Understanding MACI SustainabilityRatings
With ESG investing surpassing $40 trillion, sustainability metrics are no longer optional—they directly impact financial markets. But traditional ESG ratings often miss the biggest contributor to emissions: Scope 3 (supply chain & product lifecycle).
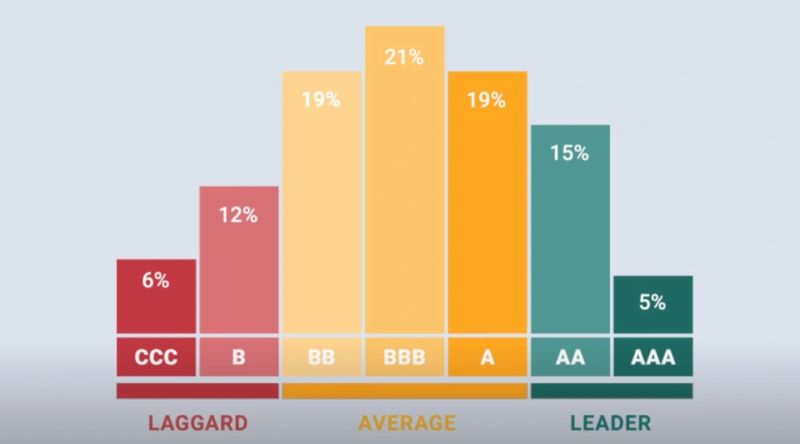
Enter MACI (Morningstar Absolute Carbon Impact)—a next-gen sustainability metric designed to measure real carbon impact, beyond corporate disclosures.
🔎 What is MACI?
📌 MACI (Morningstar Absolute Carbon Impact) is a carbon-focused rating that quantifies total emissions, unlike traditional ESG scores that rely on self-reported data.
✅ Scope 1 – Direct emissions from company operations
✅ Scope 2 – Indirect emissions from purchased energy
✅ Scope 3 – Supply chain & product lifecycle emissions (often 80-95% of total emissions)
📊 Only 5% of companies currently disclose full Scope 3 data, despite it making up 75% or more of their total carbon footprint. MACI ensures investors see the full picture.
🌍 Why is MACI a Game-Changer?
🟢 Exposes True Carbon Impact
📌 Over 90% of S&P 500 companies report ESG data, but less than 30% include Scope 3 emissions. MACI forces transparency by measuring actual environmental impact.
💰 Links Carbon Impact to Financial Risk
📌 Firms with high Scope 3 emissions face 10-15% valuation risks due to carbon pricing, regulation, and shifting consumer demand. Investors using MACI can identify & price these risks early.
📊 Goes Beyond Traditional ESG Ratings
📌 MSCI, Sustainalytics, & CDP rely on corporate sustainability claims—but MACI measures actual emissions data. This removes greenwashing from ESG scores.
🚀 Guides Net Zero Investments
📌 81% of global companies have Net Zero goals, but only 19% have credible transition plans. MACI identifies companies actually reducing emissions, ensuring investors back real sustainability leaders.
💡 How Financial Markets Depend on MACI
🏦 Sustainable Finance
📌 #$500 billion in Green Bonds & ESG Funds rely on sustainability scores. MACI ensures these funds actually reduce carbon impact.
📉 Investment Risk Assessment
📌 Climate risk is now considered a financial risk. Regulated markets (EU, US, UK, APAC) require stricter carbon disclosure. MACI helps investors assess exposure before risks impact stock prices.
📜 Regulatory Compliance
📌 The EU Taxonomy, SEC Climate Disclosures, & IFRS ESG Standards will require comprehensive Scope 3 reporting. MACI aligns with these frameworks, ensuring compliance-ready investments.
🔥 The Takeaway
As corporate greenwashing grows, investors need credible carbon metrics that go beyond PR campaigns. MACI is setting the new standard for data-driven sustainability investing.

Originally published on LinkedIn on 2025-02-27 01:47:03: https://www.linkedin.com/feed/update/urn%3Ali%3AgroupPost%3A9088131-7300692883345412096
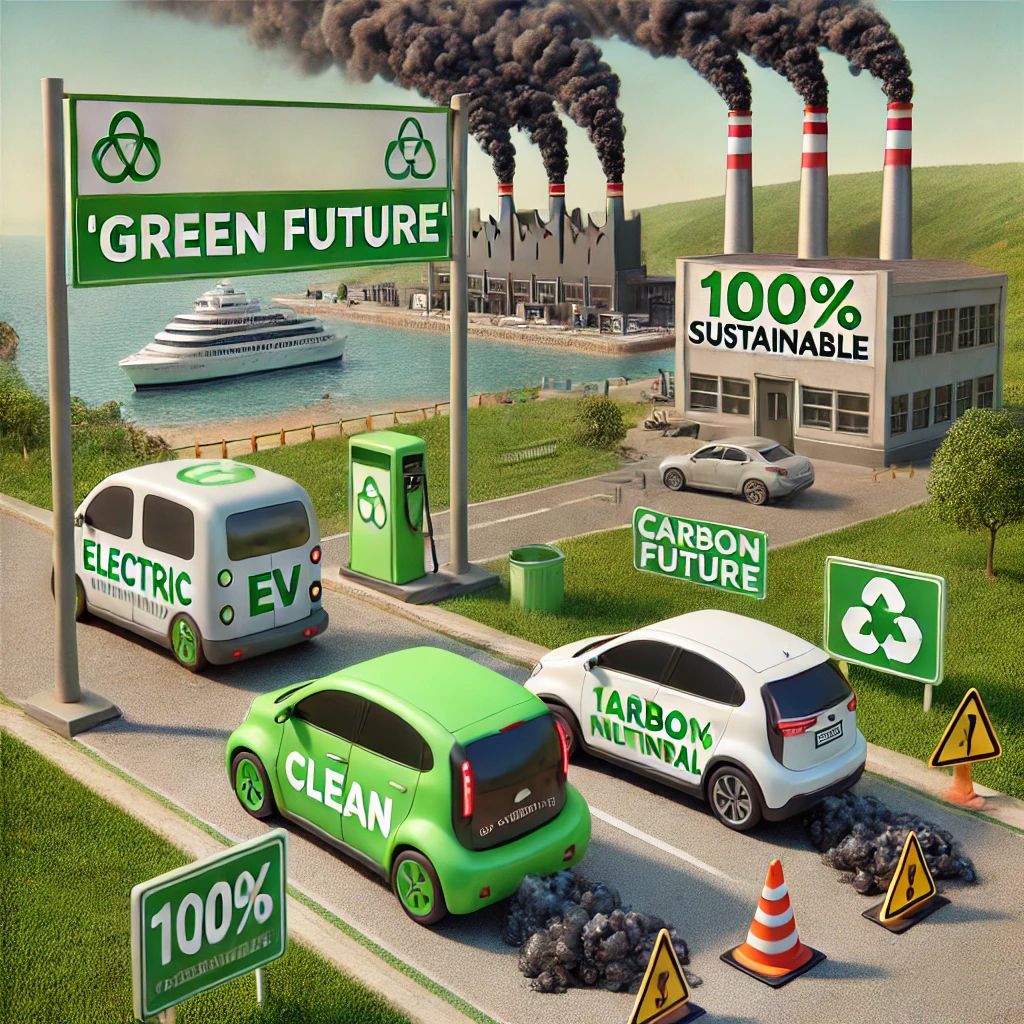
🚗⚡ YR2035’s Green_Auto_Mirage: Are EVs, Hydrogen Fuel Cells, and Synthetic Fuels Truly Sustainable or Just Greenwashing? 🌍💨
As we race toward 2035’s petrol-diesel ban, automakers push EVs, HFCVs, and SyntheticFuels as the future. But are these real solutions or clever marketing?
🔋 EVs: Cleaner or Just Elsewhere Emissions?
📌 Battery Production: An 80 kWh battery emits 2.4 – 16 metric tons of CO₂—equal to driving a gasoline car for 5-7 years. (MIT, 2024)
📌 Resource Impact: Each EV battery needs 63kg lithium, cobalt, & nickel, causing deforestation & water pollution. (GreenCars, 2024)
📌 Power Grid Dependence: An EV running on coal-based electricity emits more CO₂ per mile than hybrids. (EPA, 2024)
📌 Reality Check: EVs help only if powered by clean energy.
💧 Hydrogen: Clean Hype or Fossil Fuel Disguise?
📌 Production Problem: 96% of global hydrogen is made from natural gas & coal, emitting 830M metric tons of CO₂. (IEA, 2024)
📌 Efficiency Loss: HFCVs require 3x more renewable electricity than EVs. (US DOE, 2024)
📌 Reality Check: Unless made from renewables, hydrogen is just another fossil fuel.
⛽ Synthetic Fuels: Carbon-Neutral or Clever Greenwashing?
📌 Energy Guzzler: Producing 1L of synthetic fuel takes 6x more energy than refining petrol. (Fraunhofer, 2024)
📌 Still Polluting: Burns CO₂ and emits more NOx than conventional fuels. (MDPI, 2024)
📌 Reality Check: Synthetic fuels aren’t zero-emission—they just relocate pollution.
🚨 Greenwashing in the Auto Industry
🔻 BMW, Toyota, Honda exaggerated EV carbon savings by omitting battery emissions. (Greenpeace, 2024)
🔻 Porsche’s synthetic fuel plant claims zero emissions but runs on coal-powered electricity. (The Guardian, 2024)
🔻 India & U.S. promised 1M EV chargers by 2025, yet less than 20% installed. (BloombergNEF, 2024)
📌 Reality Check: Many automakers sell ‘green’ promises, but not real sustainability.
🏆 Key Takeaway: Hype or Hope?
🚘 EVs, HFCVs, & Synthetic Fuels could be clean if the supply chain is green.
♻️ They should be backed by strict sustainability policies.
⚠️ But they would be just another greenwashing scandal if industries don’t walk the talk.
👉 Are we truly heading toward sustainable mobility, or just another green illusion? 👇
Originally published on LinkedIn on 2025-02-18 11:22:14: https://www.linkedin.com/feed/update/urn%3Ali%3AgroupPost%3A82093-7297576141614190592
♻️ “The_War_on_Waste: Who’s Leading & Who’s Losing?” 🌍🚨
Governments ban plastics, promote recycling, and push circular economies, but is waste truly being reduced or just shifting elsewhere? Here’s the country-wise reality based on hard data.
🌎 Plastic_Waste: The Biggest Polluters
✅ Top Plastic Waste Generators (Million Tons Annually):
🇺🇸 USA – 42M tons (World Bank, 2023)
🇨🇳 China – 21M tons (Statista, 2024)
🇮🇳 India – 10M tons (CPCB, 2024)
🚨 Reality Check: 94 countries banned plastics, but only 9% is actually recycled. (UNEP, 2024)
🏆 Winners: 🇪🇺 EU Nations (strict bans & recycling laws)
❌ Losers: 🇺🇸 🇮🇳 🇨🇳 (high waste, low recycling rates)
👗 Fast_Fashion & E_Waste: The Hidden Trash Crisis
✅ Top Fast Fashion Waste Producers:
🇨🇳 China – 26M tons annually (Greenpeace, 2024)
🇺🇸 USA – 11.3M tons landfilled yearly (EPA, 2023)
🇪🇺 EU – 5.8M tons discarded (EU Commission, 2024)
🚨 Reality Check: Only 17% of global e-waste is properly recycled.
🏆 Winners: 🇯🇵 🇩🇪 🇰🇷 (advanced e-waste policies)
❌ Losers: 🇺🇸 🇮🇳 🇨🇳 (high waste, poor recycling infrastructure)
♻️ Recycling: Who’s Actually Doing It?
✅ Top Recycling Countries (% Recycled Waste):
🇩🇪 Germany – 67% (Highest global rate, Statista, 2024)
🇰🇷 South Korea – 59% (Strict sorting laws)
🇸🇪 Sweden – *50% recycling + 50% waste-to-energy
🚨 Worst Recycling Rates:
🇮🇳 India – 30% recycling rate (CPCB, 2024)
🇺🇸 USA – 32%, most plastic exported (EPA, 2023)
🇨🇳 China – 28% (Statista, 2024)
🏆 Winners: 🇩🇪 🇰🇷 🇸🇪 (high recycling & circular economy initiatives)
❌ Losers: 🇺🇸 🇮🇳 🇨🇳 (high waste, low recycling rates)
🌍 Circular Economy: Real Shift or Just Talk?
✅ EU Circular Economy Package: 65% recycling target by 2035 (EU Commission, 2024)
✅ China’s ‘Zero Waste Cities’: Pilot in 16 cities to cut landfill waste (China’s Environment Ministry, 2024)
✅ India’s EPR Policy: Firms must recover plastic waste they produce (CPCB, 2024)
🚨 Reality Check: Less than 10% of companies comply with waste responsibility laws. (Greenpeace, 2023)
🏆 Winners: 🇪🇺 EU Nations, 🇨🇳 China (pushing policy enforcement)
❌ Losers: 🇺🇸 USA (low producer responsibility laws)
🏆 KeyTakeaway
The War on Waste isn’t just about bans—it’s about holding corporations accountable, enforcing policies, and cutting overproduction.
🌍 Some nations lead, others drown in trash. Where does your country stand?
👉 Are we winning or just moving waste elsewhere?
WasteCrisis CircularEconomy PlasticPollution RecyclingMyths Sustainability NetZero


Originally published on LinkedIn on 2025-01-31 03:03:19: https://www.linkedin.com/feed/update/urn%3Ali%3AgroupPost%3A131340-7290927601190100992

Originally published on LinkedIn on 2024-08-28 14:46:15: https://www.linkedin.com/feed/update/urn%3Ali%3Ashare%3A7234571994841661440

