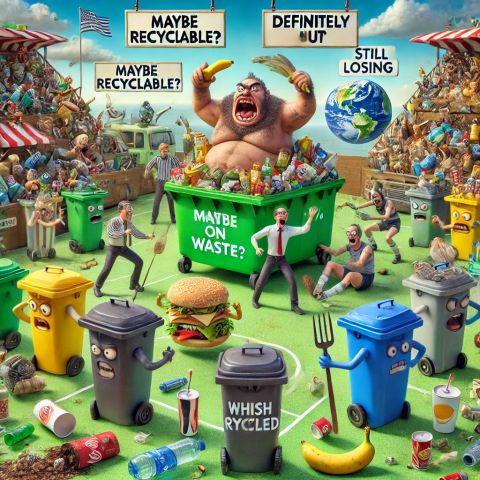
♻️ “The_War_on_Waste: Who’s Leading & Who’s Losing?” 🌍🚨
Governments ban plastics, promote recycling, and push circular economies, but is waste truly being reduced or just shifting elsewhere? Here’s the country-wise reality based on hard data.
🌎 Plastic_Waste: The Biggest Polluters
✅ Top Plastic Waste Generators (Million Tons Annually):
🇺🇸 USA – 42M tons (World Bank, 2023)
🇨🇳 China – 21M tons (Statista, 2024)
🇮🇳 India – 10M tons (CPCB, 2024)
🚨 Reality Check: 94 countries banned plastics, but only 9% is actually recycled. (UNEP, 2024)
🏆 Winners: 🇪🇺 EU Nations (strict bans & recycling laws)
❌ Losers: 🇺🇸 🇮🇳 🇨🇳 (high waste, low recycling rates)
👗 Fast_Fashion & E_Waste: The Hidden Trash Crisis
✅ Top Fast Fashion Waste Producers:
🇨🇳 China – 26M tons annually (Greenpeace, 2024)
🇺🇸 USA – 11.3M tons landfilled yearly (EPA, 2023)
🇪🇺 EU – 5.8M tons discarded (EU Commission, 2024)
🚨 Reality Check: Only 17% of global e-waste is properly recycled.
🏆 Winners: 🇯🇵 🇩🇪 🇰🇷 (advanced e-waste policies)
❌ Losers: 🇺🇸 🇮🇳 🇨🇳 (high waste, poor recycling infrastructure)
♻️ Recycling: Who’s Actually Doing It?
✅ Top Recycling Countries (% Recycled Waste):
🇩🇪 Germany – 67% (Highest global rate, Statista, 2024)
🇰🇷 South Korea – 59% (Strict sorting laws)
🇸🇪 Sweden – *50% recycling + 50% waste-to-energy
🚨 Worst Recycling Rates:
🇮🇳 India – 30% recycling rate (CPCB, 2024)
🇺🇸 USA – 32%, most plastic exported (EPA, 2023)
🇨🇳 China – 28% (Statista, 2024)
🏆 Winners: 🇩🇪 🇰🇷 🇸🇪 (high recycling & circular economy initiatives)
❌ Losers: 🇺🇸 🇮🇳 🇨🇳 (high waste, low recycling rates)
🌍 Circular Economy: Real Shift or Just Talk?
✅ EU Circular Economy Package: 65% recycling target by 2035 (EU Commission, 2024)
✅ China’s ‘Zero Waste Cities’: Pilot in 16 cities to cut landfill waste (China’s Environment Ministry, 2024)
✅ India’s EPR Policy: Firms must recover plastic waste they produce (CPCB, 2024)
🚨 Reality Check: Less than 10% of companies comply with waste responsibility laws. (Greenpeace, 2023)
🏆 Winners: 🇪🇺 EU Nations, 🇨🇳 China (pushing policy enforcement)
❌ Losers: 🇺🇸 USA (low producer responsibility laws)
🏆 KeyTakeaway
The War on Waste isn’t just about bans—it’s about holding corporations accountable, enforcing policies, and cutting overproduction.
🌍 Some nations lead, others drown in trash. Where does your country stand?
👉 Are we winning or just moving waste elsewhere?
WasteCrisis CircularEconomy PlasticPollution RecyclingMyths Sustainability NetZero


Originally published on LinkedIn on 2025-01-31 03:03:19: https://www.linkedin.com/feed/update/urn%3Ali%3AgroupPost%3A131340-7290927601190100992
NamasteGreenIndia’s DDGS Export Boom: USD 717 Million Market, But 2025 Holds the Key
The Surge: A 314% Export Boom
India is making waves in the global Distillers Dried Grains with Solubles (DDGS) market, a key ethanol byproduct used as animal feed. Here’s the story behind the numbers:
📦 1,212 shipments of DDGS in the last 12 months (314% growth).
🌏 Major buyers:
🇻🇳 Vietnam: 51% share.
🇳🇵 Nepal: 21% share.
🇺🇸 United States: 7% share.
💰 Market Value:
2023: USD 420.67 million.
2032 (Projected): USD 717.81 million (CAGR: 6.17%).
The Challenge: Falling Prices
Despite the export surge, the industry is battling a steep price drop:
🏷️ Domestic DDGS prices: #₹14–15/kg (~USD 0.17–0.18).
🌍 Global competition and oversupply are hitting margins hard.
1. Expanded Production Capabilities:
With ethanol blending targets set to increase to 20% by 2025, India’s DDGS production will reach record levels.
2. Market Diversification:
New export agreements with Africa, Southeast Asia, and Latin America are expected to reduce over-reliance on existing markets like Vietnam and Nepal.
3. Government Interventions:
Policies promoting minimum price guarantees and export incentives are likely to stabilize DDGS prices.
Focus on value-added DDGS products, such as enriched feed, to attract premium markets.
4. Sustainability Push:
Growing demand for sustainable feed solutions globally aligns perfectly with DDGS as a cost-effective, eco-friendly option.
Indian DDGS could gain significant traction in European markets following stricter feed sustainability regulations.
5. Technological Advancements:
Adoption of advanced processing techniques will improve DDGS quality and reduce production costs, ensuring competitiveness in global markets.
India is turning its ethanol growth into a global export advantage, but to sustain the momentum in 2025 and beyond:
🛠️ Strengthen Domestic Support: Build strategic reserves to manage price fluctuations.
🌍 Capture New Markets: Target countries with rising feed demand like Brazil, Indonesia, and Nigeria.
🚀 Lead the Sustainability Charge: Establish India as a key supplier of sustainable animal feed.
Why It Matters
India’s ethanol-driven DDGS market is poised for exponential growth in 2025. By embracing innovation, diversification, and sustainability, India can become a global powerhouse in the animal feed sector while ensuring long-term industry stability.
💬 Let’s connect to explore how IndiaExports and EthanolEconomy are setting the stage for a transformative 2025. 🚀
Originally published on LinkedIn on 2025-01-15 19:30:29: https://www.linkedin.com/feed/update/urn%3Ali%3Ashare%3A7285377825862283264

