🌍 GeopoliticalFlashFloodIndex (GFFI)3Decade 11Events
Dr. Anju Sharma | MrsSustainability | KtalystInsights
Geopolitical crises no longer move slowly. They behave like flash floods, transmitting through the global economy in a predictable sequence:
Conflict → Energy → Markets → Capital → SupplyChains
🌐 11Largest GeopoliticalShocks (1999–2024)
Ranked by Geopolitical Flash Flood Index (GFFI)
1️⃣ Russia–Ukraine War (2022) | GFFI 2.4
European gas crisis • Oil & LNG spikes • Grain disruption → inflation
2️⃣ COVID Global Shutdown (2020) | GFFI 2.3
Production freeze • Financial crash • Logistics paralysis
3️⃣ 9/11 Terror Attacks (2001) | GFFI 2.0
Market shutdown • Aviation collapse • Security restructuring
4️⃣ Iraq War (2003) | GFFI 1.8
Oil volatility • Middle East instability • Supply chain repricing
5️⃣ Saudi Aramco Abqaiq Attack (2019) | GFFI 1.7
5% global oil supply disrupted overnight
6️⃣ Crimea Annexation (2014) | GFFI 1.6
Sanctions on Russia • Energy market uncertainty
7️⃣ U.S.–China Trade War (2018) | GFFI 1.5
$350B tariffs • Supply chain migration
8️⃣ Red Sea Shipping Crisis (2024) | GFFI 1.5
Suez disruption • Insurance surge • Africa rerouting
9️⃣ Arab Spring Oil Disruptions (2011) | GFFI 1.4
Libyan oil collapse • Brent spike
🔟 Kosovo War (1999) | GFFI 1.3
NATO intervention • European instability
1️⃣1️⃣ Israel–Hamas War (2023) | GFFI 1.3
Middle East risk premium • Energy shipping risks.
📊 What 3DecadeData Reveals
1️⃣ Energy transmits the shock first
~30% global seaborne oil via Hormuz
~12% global trade via Suez
~20% LNG through Middle East routes
Energy shocks rapidly become inflation shocks.
2️⃣ Markets before governments
Markets reprice geopolitical risk within hours. Policy responses follow weeks later.
Financial volatility becomes the first alarm system.
3️⃣ SupplyChains move slowest
Structural adjustments take years, not months:
Europe’s gas diversification after 2022
China+1 manufacturing shift
Red Sea reroutes adding 10–15 days
Resilience competes with efficiency.
Geopolitical crises rarely destroy companies, execution dysfunction does. Resilient organizations practice five strategic habits:
✔ Signal Intelligence – treat energy, freight, insurance spikes as early signals
✔ Scenario Discipline – rehearse geopolitical shocks in advance
✔ Coordinated Execution – align finance, procurement, logistics
✔ Networked Supply Chains – multi-route sourcing and logistics
✔ Margin Strategy – protect pricing power and portfolio resilience
The difference between crisis and opportunity is reaction speed.
GFFI Geopolitical Flash Flood Index
GFFI = 0.30E + 0.25M + 0.20C + 0.20S + 0.05P
E = Energy Shock
M = Market Repricing
C = Capital Rotation
S = Supply Chain Impact
P = Policy Lag
Higher score, faster systemic disruption. ( for Customized versions ping us)
Originally published on LinkedIn on 2026-03-04 06:29:35: https://www.linkedin.com/feed/update/urn%3Ali%3Ashare%3A7434847493542039552
📊 KtalystInsight | Inflation: Who StayedGreen When the World Paid?
🌍 A global reset decoded — with flags, facts & fiscal firepower
InflationWatch GeoEconomics KtalystKeystone
💥 Between 2022 and 2024, inflation was the uninvited global guest.
Some economies panicked.
Others pivoted, performed, and profited.
So, who made the most of the macro mess?
🏆 The Strategic Winners
(Not just survivors — system optimizers.)
🔹 🇮🇳 India | 6.7% → 2.8%
→ Digital public infra (UPI, DBT), FDI magnet, fiscal discipline
🔹 🇺🇸 USA | 8.0% → 2.35%
→ Soft landing playbook, textbook Fed moves, labor resilience
🔹 🇪🇺 Eurozone | 8.4% → 2.4%
→ ECB calibration, energy reorientation, united policy front
🔹 🇬🇧 UK | 11.1% → 2.3%
→ Tackled wage spiral, central bank credibility rebuilt
🔹 🇧🇷 Brazil | 10.1% → 3.6%
→ Commodity export surge, inflation dipped with discipline
🔹 🇸🇦 Saudi Arabia | 3.2% → 1.6%
→ Oil windfall = Vision 2030 funding + sovereign muscle
🔹 🇮🇩 Indonesia | 5.5% → 2.8%
→ Nickel & EV boom, food security, smart monetary strategy
🔹 🇷🇺 Russia | 13.8% → 6.0%
→ Energy rerouting, currency lockdown (short-term buffer only)
🚨 The Strugglers
(Where inflation exposed institutional cracks.)
🔻 🇹🇷 Turkey | 64% → 70%+
🔻 🇦🇷 Argentina | 72% → 140%+
🔻 🇱🇧 Lebanon | 170%+ collapse
📉 Currency freefall.
📉 No policy credibility.
📉 Public trust: vanished.
💬 Ktalyst Quote Drop
> “Productivity isn’t everything, but in the long run it’s almost everything.
Paul Krugman
📌 The real gainers?
Those who treated inflation not as an excuse — but a trigger for transformation.
🎯 KtalystTakeaway
✔️ Inflation was universal. Response wasn’t.
✔️ Strategy, systems, and digital delivery = real differentiators.
✔️ Macro maturity > monetary panic.
📝 Note:
We’ve used actual inflation ranges (2022–2025) instead of arrows (⬆/⬇) to show clear, measurable trends — because in policy and business, data speaks louder than symbols.
Originally published on LinkedIn on 2025-06-15 05:54:40: https://www.linkedin.com/feed/update/urn%3Ali%3AgroupPost%3A82951-7339893086929444865
KtalystKnowledgeSeries
USA SustainabilitySnapshot: Goals, Data & Drive
Targets are timelines. Transformation is the true triumph.” — KtalystKeystone
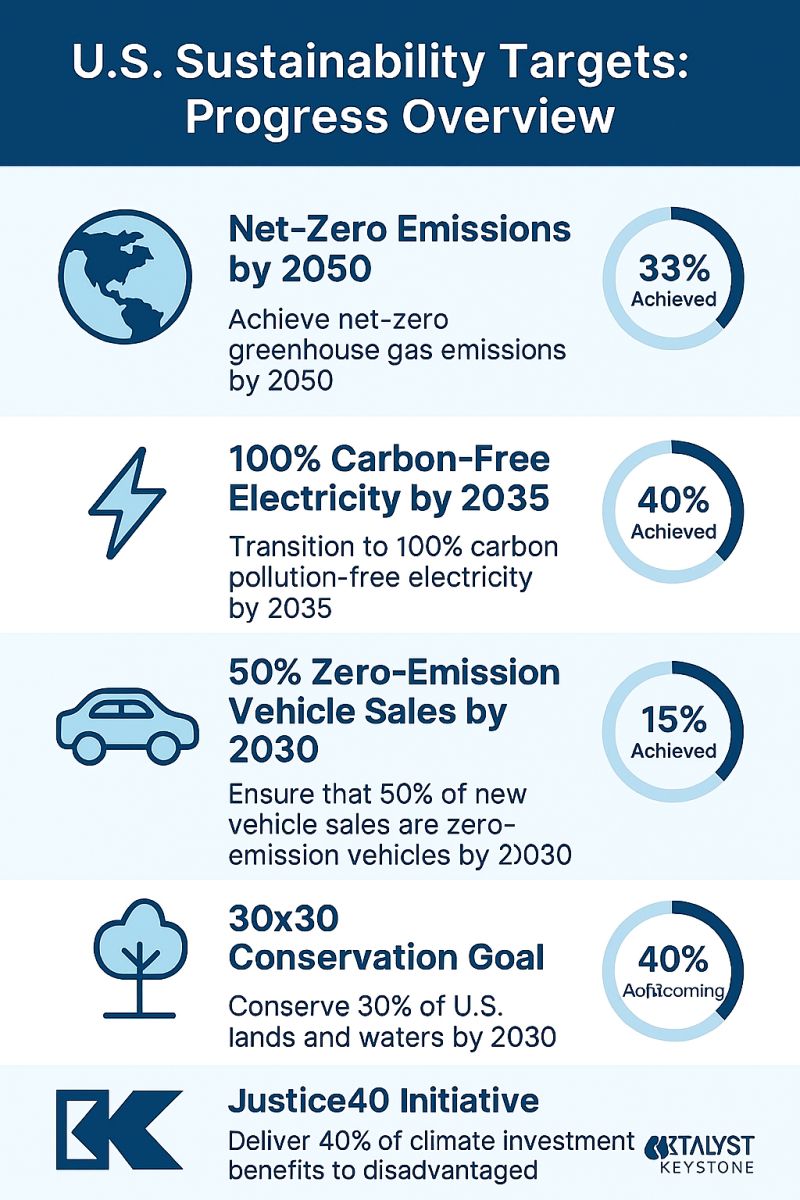
🌎 Net-Zero Ambition
Goal: Achieve net-zero emissions by 2050
Current Status: U.S. emissions were 17% below 2005 levels by 2023
Key Driver: Clean power shift, IRA incentives
Targets are timelines. Transformation is the true triumph.
⚡ Clean Power by 2035
Goal: 100% carbon-free electricity
Progress:
2023: ~41% from clean sources (solar, wind, nuclear, hydro)
Solar capacity: Quadrupled since 2015
Investment Push: $369B via Inflation Reduction Act
🚗 EV Nation
Goal: 50% new vehicle sales electric by 2030
2023 Stats:
EVs = 7.6% of total new U.S. car sales
500,000 EV chargers planned by 2030
♻️ Circular America
Goal: Cut food waste by 50% by 2030
Current:
30–40% of food still wasted
National Strategy launched in 2023 for plastics reduction & reuse
🌿 Nature Positive (30×30 Goal)
Goal: Conserve 30% of land & water by 2030
Status:
~12% of U.S. land currently protected
New partnerships with Indigenous and rural communities
⚖️ Justice40 Initiative
Goal: 40% of climate investments to disadvantaged communities
Covered Sectors:
Clean transit
Pollution clean-up
Water access
Workforce training
Tracking Tool: CEJST (Climate & Economic Justice Screening Tool)
📊 Climate Data Commitment
Goal: Enhance climate risk transparency
Push:
SEC climate disclosure rules (proposed)
Federal agencies adopting climate risk dashboards

Originally published on LinkedIn on 2025-04-09 06:22:18: https://www.linkedin.com/feed/update/urn%3Ali%3AgroupPost%3A82951-7315620051338825728
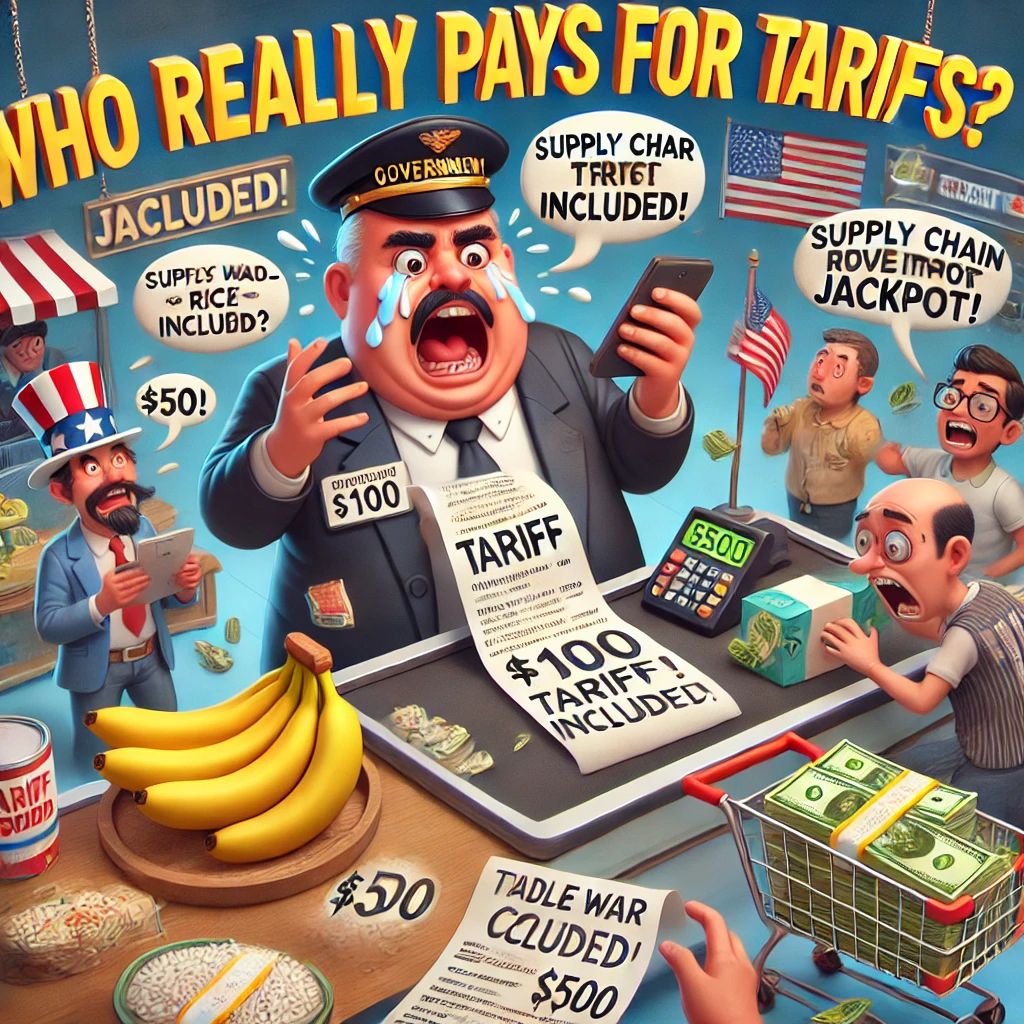
💰🌎 Tariff Wars: Who Really Pays the Price?
As governments escalate trade wars, businesses adjust supply chains, and consumers brace for price hikes, are tariffs truly protecting economies, or just shifting the cost?
🚨 Who Pays for Tariffs?
📉 Consumers Bear the Burden – 60% of tariff costs are passed on to consumers through higher prices. (IMF, 2024)
📉 Businesses Face Higher Costs – US companies paid $105B in tariffs since 2018, impacting supply chains. (USTR, 2024)
📉 Job Loss Risks – Tariffs on auto parts could cost 700K US jobs as production shifts. (Peterson Institute, 2024)
📉 Inflation Pressure – Every 10% tariff hike increases inflation by 0.5% globally. (World Bank, 2024)
📌 Reality Check: Tariffs aren’t just taxes on imports—they’re taxes on people.
🏆 Who Benefits?
✅ Governments Cash In – Tariffs generated $80B for the US Treasury in 2023. (USTR, 2024)
✅ Local Manufacturers Get Protection – Steel & aluminum industries saw a 20% production boost. (Reuters, 2024)
✅ Nearshoring Countries Profit – Mexico & Vietnam gained $65B in trade diversions from China. (IMF, 2024)
📌 Reality Check: While some industries win, the average consumer still loses.
🔮 What’s Next?
💡 Regional Trade Over Globalization – Supply chains are shifting closer to home to avoid tariff risks.
💡 Digital & AI Trade Solutions – Automated trade processing could reduce costs by 15%. (McKinsey, 2024)
💡 Green Tariffs Rising – Carbon-based tariffs will add new costs to imports, reshaping global trade. (EU CBAM, 2024)
📌 Reality Check: The cost of tariffs may outweigh the benefits if trade wars escalate.
🏆 KeyTakeaway
Tariffs could be a tool for protecting industries, should be used strategically, but would be an economic strain if prices keep rising.
👉 Who really pays for the trade war—governments, businesses, or you?
TradeWar Tariffs GlobalEconomy SupplyChainCrisis Inflation
Originally published on LinkedIn on 2025-02-05 16:37:39: https://www.linkedin.com/feed/update/urn%3Ali%3AgroupPost%3A2474261-7292944474018611204
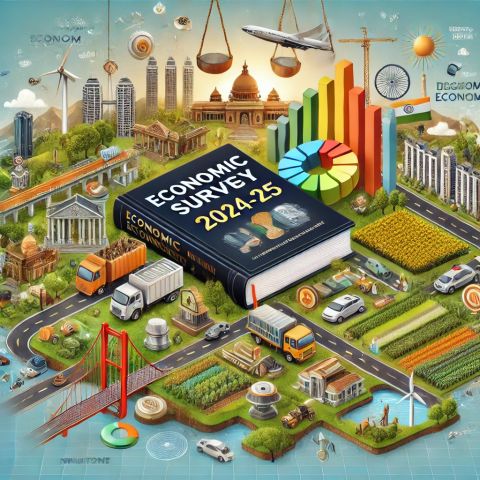
📊 India_Economic_Survey_2024-25: Growth, Resilience & Future Focus 🇮🇳📈
India’s economy is defying global uncertainties, powered by investment, reforms, and innovation. Here’s a concise breakdown of the key takeaways.
🌏 Economic Strength & Fiscal Health
✅ Growth remains strong, driven by domestic investment.
✅ Inflation moderate, but food prices remain volatile.
✅ Capital spending up, ensuring long-term stability.
🏆 Key Shift: India prioritizes investment over short-term spending.
💰 Banking & Financial Sector
✅ Low NPAs & strong credit growth signal a healthy banking sector.
✅ Global interest rate risks monitored to ensure market stability.
🏆 Key Shift: A robust financial system supports economic momentum.
🌐 Trade & External Sector
✅ FDI remains a focus, with business reforms easing entry.
✅ Export challenges persist, due to global trade tensions.
✅ Reducing import dependency on China to boost self-reliance.
🏆 Key Shift: Reshaping trade policies to adapt to global disruptions.
🏗️ Infrastructure & Industry
✅ Post-election boost to infrastructure—transport, digital, energy.
✅ MSMEs get policy push, enhancing industrial output.
🏆 Key Shift: Building for the future with targeted investments.
🌱 Climate & Sustainability
✅ Energy transition & green investments expanding.
✅ Air pollution & emissions remain critical issues.
🏆 Key Shift: Sustainability is now a policy priority, not an afterthought.
🚀 Employment, AI & Future of Work
✅ Upskilling & gig economy shaping future jobs.
✅ AI disruption expected, but workforce adaptation in progress.
🏆 Key Shift: Balancing tech advancement with job security.
📈 Vision 2047: India’s Long-Term Economic Strategy
✅ Deregulation & ease of doing business accelerating growth.
✅ Viksit Bharat 2047 aims to make India a developed economy.
🏆 Key Shift: From short-term fixes to long-term economic transformation.
🏆 KeyTakeaway
India’s Economic Survey 2024-25 highlights resilience, investment-driven growth, and policy innovation. The focus is on long-term stability, sustainability, and self-reliance.
👉 Is India ready for its next economic leap?
EconomicSurvey IndiaGrowth Infrastructure GreenEconomy DigitalIndia ViksitBharat2047
Originally published on LinkedIn on 2025-01-31 19:21:29: https://www.linkedin.com/feed/update/urn%3Ali%3Ashare%3A7291173766041059329

