KatalystKnowledge | The FitFor55 Formula: Europe’s Race Against Time
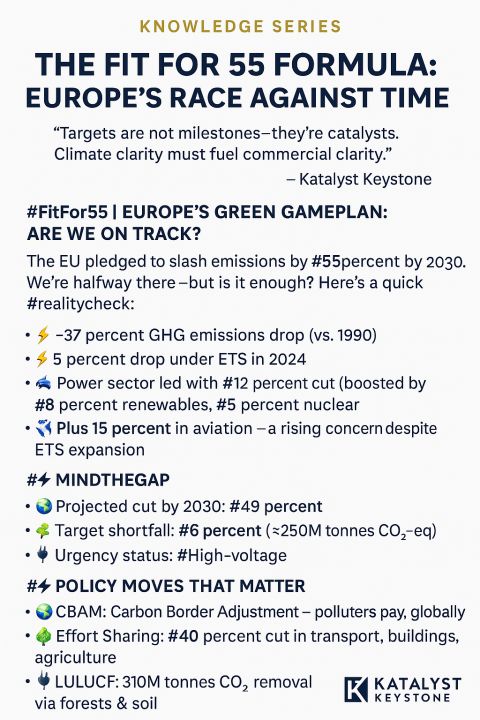
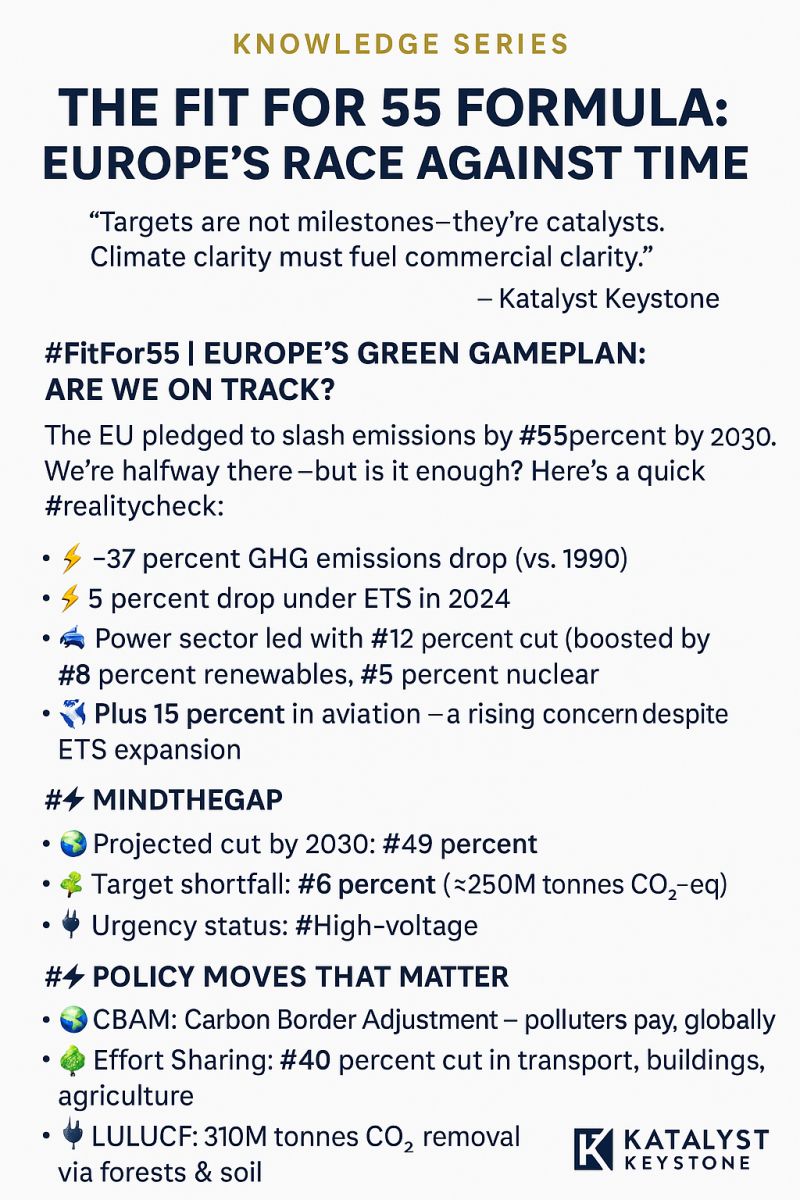
Targets are not milestones—they’re catalysts. Climate clarity must fuel commercial clarity.
KtalystKeystone
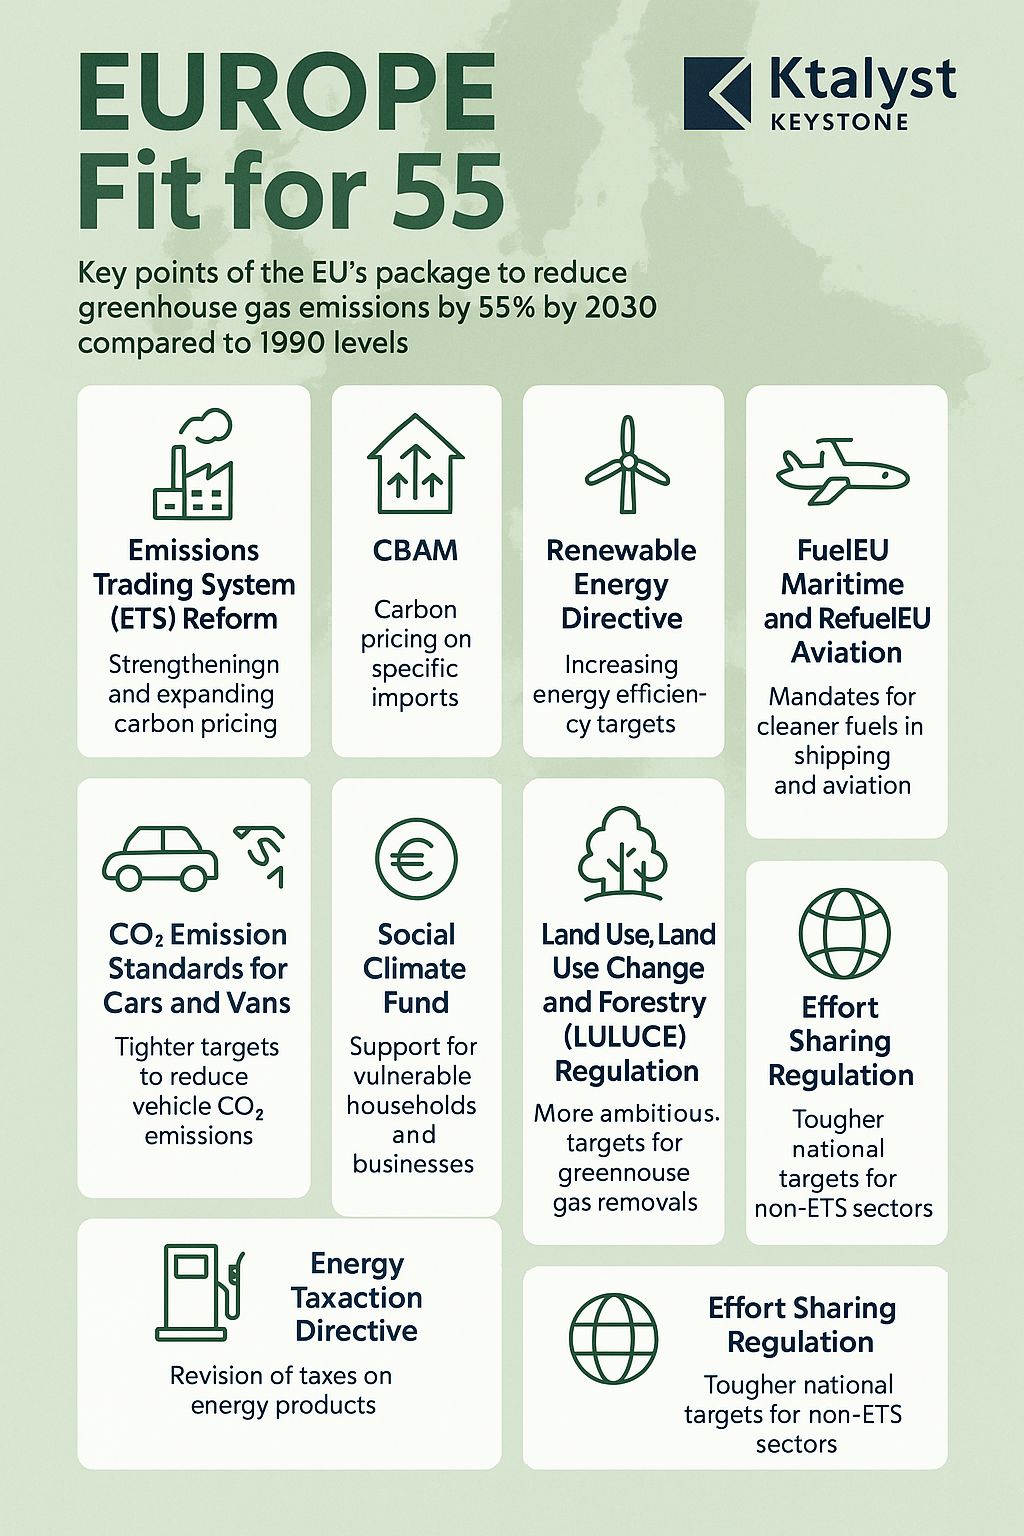
FitFor55 | Europe’s Green Gameplan: Are We On Track?
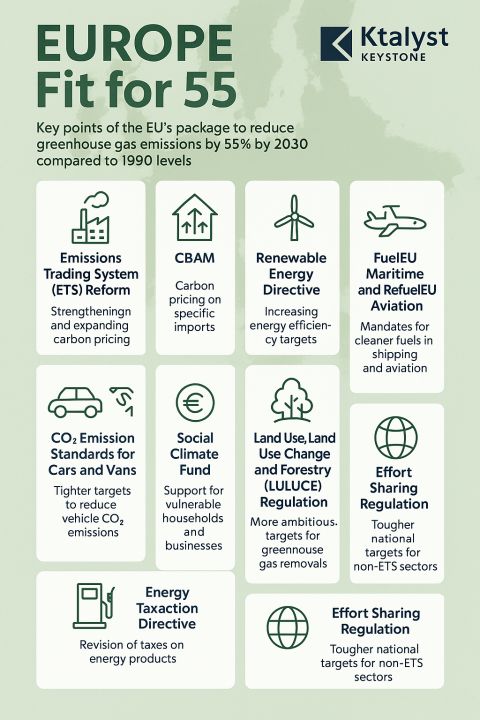
The EU pledged to slash emissions by 55percent by 2030. We’re halfway there—but is it enough? Here’s a quick realitycheck:
#️Progress So Far
⚡ Minus 37 percent GHG emissions drop (vs. 1990)
♻️ 5 percent drop under ETS in 2024
⚡ Power sector led with 12 percent cut (boosted by 8 percent renewables, 5 percent nuclear)
✈️ Plus 15 percent in aviation—a rising concern despite ETS expansion
🏭 Industry? Flat. Cement down, fertilizers up
MindTheGap
Projected cut by 2030: 49 percent
Target shortfall: 6 percent (≈250M tonnes CO₂-eq)
Urgency status: High-voltage
Policy Moves That Matter
🌍 CBAM: Carbon Border Adjustment – polluters pay, globally
🛣️ Effort Sharing: 40 percent cut in transport, buildings, agriculture
🌳 LULUCF: 310M tonnes CO₂ removal via forests & soil
🔌 Renewables Goal: 42.5 percent by 2030 (plus 2.5 percent aspirational boost to 45 percent)
Takeaway
The EU is moving—but not fast enough.
To reach the finish line:
Scale green hydrogen & biofuels
Electrify transport
Cut industrial emissions deeper
LeadershipLens
Green goals aren’t just numbers.
They’re strategy. They’re urgency. They’re our business future.
KtalystKeystone Insight:
We help you align business with policy—because climate clarity = profit clarity.
Originally published on LinkedIn on 2025-04-09 05:45:15: https://www.linkedin.com/feed/update/urn%3Ali%3AugcPost%3A7315610730253238272
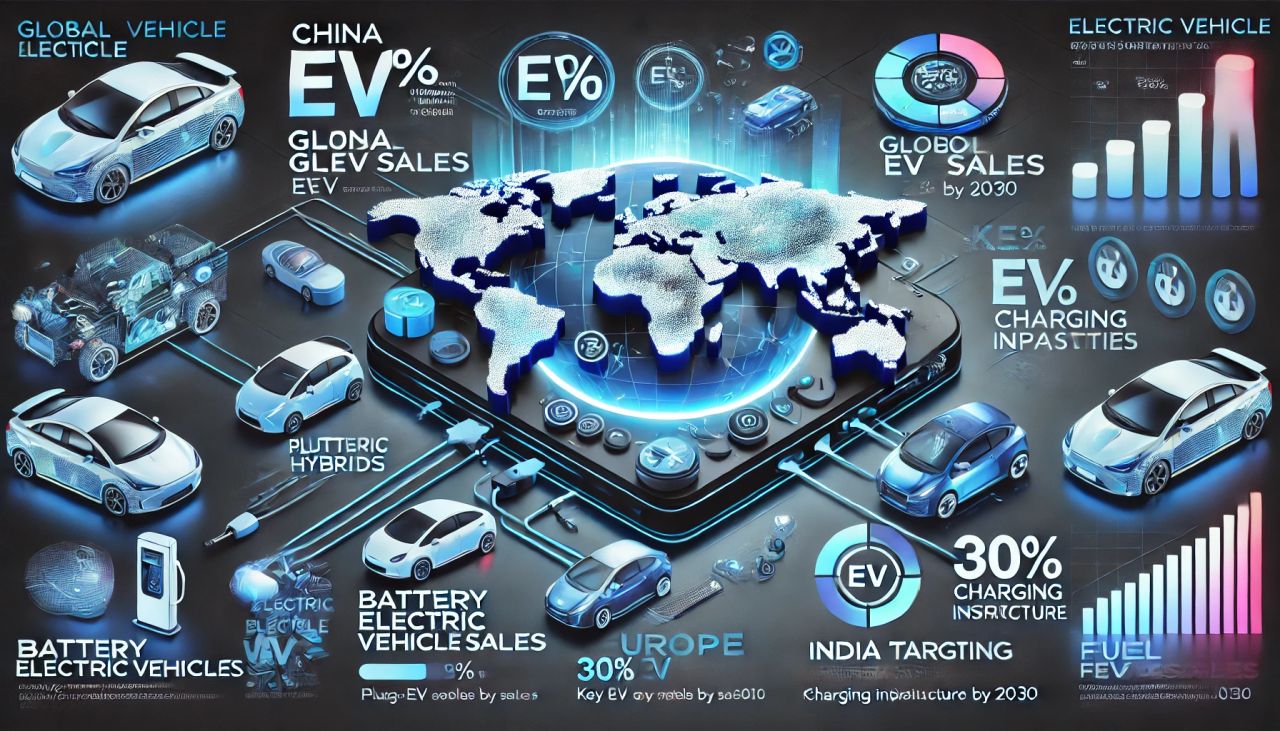
🚗⚡ EV KnowledgeSeries – Global_Perspective
🔋 What is an EV?
🔹 Uses electric motors for propulsion, reducing fossil fuel dependency.
🔹 Lowers carbon footprint, improves energy efficiency.
🔌 Types of EVs
🔋 BEVs: Fully electric, no fuel. ⚡ Tesla Model 3, Nissan Leaf
🔋 HEVs: Fuel + electric motor, self-charging. 🚗 Toyota Prius, Honda City e:HEV
🔋 PHEVs: Can be externally charged + fuel engine. 🔌 BMW 330e, Mitsubishi Outlander PHEV
🔋 FCEVs: Hydrogen fuel cell-powered. 💧 Toyota Mirai, Hyundai Nexo
📈 Global EV Market Trends
🔹 #🌍 Market Share (2024)
🔋 China: 🇨🇳 60% global EV sales.
🔋 Europe: 🇪🇺 30%+ EV adoption, Norway 80% EV sales.
🔋 USA: 🇺🇸 Rapid Tesla-led expansion.
🔋 India: 🇮🇳 5% market share, 30% target by 2030.
🔹 #🚘 Top EV Brands (2024)
🔋 #🥇 BYD (China) – 3.0M units.
🔋 #🥈 Tesla (USA) – 2.5M units.
🔋 #🥉 Volkswagen (Germany) – 1.5M units.
🔋 #🏅 Hyundai-Kia (Korea) – 1.2M units.
🔋 #🎖 Tata Motors (India) – 200K units.
⚡ EV Charging Infrastructure
🔹 #🚀 Charging Types
🔋 AC Slow Charging: ⏳ 6-12 hours (home, public).
🔋 DC Fast Charging: ⚡ 30-60 mins (public stations).
🔋 Ultra-Fast Charging: 🚀 <15 mins (Tesla Superchargers).
🔹 #🌍 Global Charging Stats
🔋 China: 🇨🇳 5M+ chargers (largest).
🔋 Europe: 🇪🇺 2.5M+ chargers.
🔋 USA: 🇺🇸 800K+ chargers.
🔋 India: 🇮🇳 10K+ chargers, 1M target by 2030.
🏛 Government Policies & Incentives
🔹 #💰 EV Incentives (2024)
🔋 #🇺🇸 USA: $7,500 tax credit.
🔋 #🇨🇳 China: Subsidies + free EV license plates.
🔋 #🇪🇺 EU: CO₂ limits, ICE ban 2035.
🔋 #🇮🇳 India: FAME-II, 5% GST, state subsidies.
🔹 #🚫 Emission Regulations
🔋 EU: ICE ban by 2035.
🔋 California: 100% ZEVs by 2035.
🔋 China: 40% EV target by 2030.
🚧 EV Challenges & Solutions
🔹 #⚠️ Challenges
🔋 Battery Cost & Supply – Lithium shortage.
🔋 Charging Infra – Insufficient fast chargers.
🔋 Range Anxiety – Fear of running out of charge.
🔋 High Cost – EVs costlier than ICE cars.
🔋 Grid Strain – Rising power demand.
🔹 #💡 Solutions
🔋 #✅ Battery Innovation – Solid-state tech.
🔋 #✅ Faster Charging – Ultra-fast networks.
🔋 #✅ Policy Push – More subsidies & infra funding.
🔮 Future of EVs – What’s Next?
🔹 #📌 2030+ Predictions
🔋 #🔹 EVs = 40-50% of new sales.
🔋 #🔹 50% cheaper batteries.
🔋 #🔹 Hydrogen FCEVs for trucking.
🔋 #🔹 V2G tech: EVs power grids.
🔋 #🔹 Solar-powered EVs.
🚀 TheEVRevolutionIsNow SustainableMobility TheFutureIsElectric
Originally published on LinkedIn on 2025-03-10 13:29:07: https://www.linkedin.com/feed/update/urn%3Ali%3Ashare%3A7304855827301961729
TheCircularEconomyBoom
📊 Market Growth: $339B → $712B (2030)
🛍 Key Sectors: ♻️ Recycling | 📦 Packaging | ⚡ Waste-to-Energy | 👕 Textile Circularity
💰 Big Investors: BlackRock | Goldman Sachs | Breakthrough Energy
Circular Economy vs. Traditional Returns
📈 ROI (5-year average):
🟢 Circular Economy: 8-12% CAGR
🔴 Traditional Markets: 5-7% CAGR
⚡ Waste-to-Energy IRR: 10-15% (Beats traditional waste management)
🛍 Consumer Trend: 73% willing to pay more for sustainability
VC & PrivateEquity Betting Big
🌎 Global Funding: $75B+ in Circular Startups
💰 Top-Funded Startups:
🔋 Northvolt – Battery Recycling
♻️ Loop Industries – Plastic Circularity
📦 Zume – Biodegradable Packaging
🚀 Major Investors: Sequoia | KKR | TPG Rise
Policy Tailwinds Driving Investments
📜 Global Incentives:
🇪🇺 EU Green Deal: €1T Sustainability Fund
🇺🇸 IRA: $370B in Climate Incentives
🇨🇳 China 5-Year Plan: $460B Circular Infra
📊 Policy-Driven Sectors: ⚡ EV Battery Recycling | 🔄 Industrial Waste Upcycling | 🌍 Carbon Markets
Circular Business Models Winning Capital
📊 High-Growth Revenue Models:
🔄 Product-as-a-Service (PaaS): 15-20% YoY
♻️ Recommerce & Reverse Logistics: 12-18% YoY
🌱 Upcycling & Material Innovation: 10-15% YoY
📌 Investment Hotspots:
🔹 Asia-Pacific – Fastest-Growing 🌏
🔹 Europe – Corporate Circular Leaders 🇪🇺
🔹 North America – VC & PE Capital Hub 💰
Impact Metrics Investors Track
📊 Data-Driven KPIs:
♻️ Material Recovery Rate – % Waste Reused
💰 Resource Productivity – GDP/kg Material
🌍 CO₂ Reduction Impact – Carbon Saved/$
📈 RoSI – Return on Sustainability Investment
🚀 Tech Game-Changers: AI & Blockchain in Circular Supply Chains
Future of Circular Investing (2025-2030)
🔮 Market Outlook:
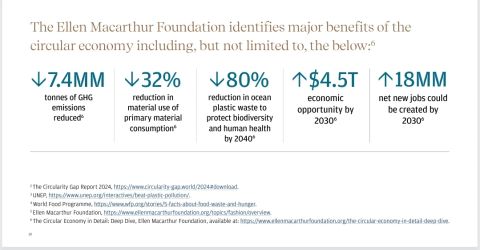
📊 $4.5T+ Circular Economy by 2030
📈 VC/PE Capital to 3x by 2028
🔥 Fastest-Growing Sectors:
🏗 Circular Construction 💰 $500B+
⚡ Green Hydrogen 💰 $600B+
🧠 AI-Driven Waste Mgmt 💰 $100B+
🌍 InvestForImpact – High returns meet sustainability. 💰♻️
💬 Which sector interests you most? Drop a comment!
CircularEconomy ImpactInvesting SustainableFinance ClimateInvestment
Originally published on LinkedIn on 2025-03-05 14:01:17: https://www.linkedin.com/feed/update/urn%3Ali%3Ashare%3A7303051986592014336
🚨 Moody’s & Sustainability: ESG is Now a Credit Rating Factor! 📊💚
With #$40T in ESG assets under management, Moody’s is reshaping how financial markets assess creditworthiness. No longer just about profits & losses, a company’s sustainability risks now directly impact credit ratings, borrowing costs, & investment potential.
🔍 How Moody’s Integrates Sustainability into Credit Ratings
🟢 ESG factors impact the credit ratings of 18% of companies & governments rated by Moody’s. (Source)
📊 Issuer Profile Scores (IPS): Measures 15 ESG subfactors (climate risk, governance strength, social responsibility).
📊 Credit Impact Scores (CIS): Rates how ESG performance affects a company’s credit rating & risk profile.
📊 Second Party Opinions (SPOs): Validates Green Bonds & Sustainability-Linked Loans, ensuring funds are climate-aligned.
🔹 Moody’s now assesses over 3,000 entities based on ESG factors.
💰 ESG & Financial Impact: Why Credit Ratings Depend on Sustainability
🏦 Banks & Investors Are Watching
📌 Companies with poor ESG ratings face higher borrowing costs, as investors demand sustainability-linked loans & bonds.
📉 Carbon-Intensive Companies Are High-Risk
📌 Firms with high Scope 3 emissions face 15-20% valuation risks due to carbon pricing & regulatory changes. (Source)
🚀 Sustainability-Linked Bonds & Loans Are Surging
📌 #$1.6T in sustainability-linked bonds & loans have been issued, with Moody’s validating green claims to prevent greenwashing. (Source)
🌍 Moody’s ESG Leadership: Recognitions & Market Influence
🏆 FTSE4Good Index Inclusion (6 Years Running) → Recognizing top ESG performers.
🏆 EcoVadis Bronze Medal → Top 35% of global companies for sustainability.
🏆 CDP Supplier Engagement Leader → Among the top 4% of companies driving supply chain decarbonization. (Source)
🔥 The Takeaway: Sustainability is No Longer Optional
🟢 18% of Moody’s rated companies now have ESG-driven credit adjustments.
🟢 Investors demand transparent sustainability metrics before lending.
🟢 Greenwashing is no longer profitable—credit ratings now hold companies accountable.
📢 Should ESG be an even bigger factor in credit ratings? Let’s discuss below! 👇

Originally published on LinkedIn on 2025-02-27 04:39:26: https://www.linkedin.com/feed/update/urn%3Ali%3AgroupPost%3A82951-7300736262829711360
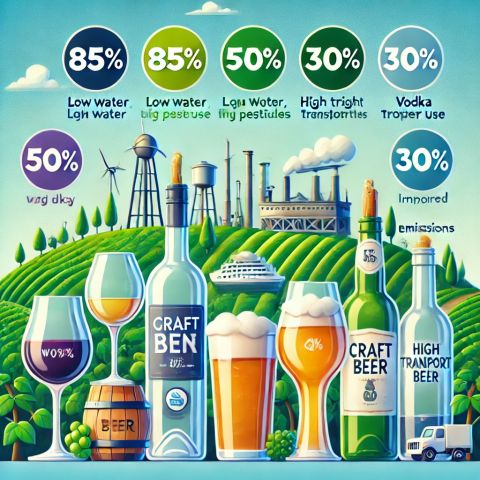
🍻🌱 “Green Booze: Is Your Drink Really Sustainable?
From beer to whiskey to wine, the alcohol industry is a silent sustainability offender—water-intensive, carbon-heavy, and waste-generating. But is booze going green, or just another case of marketing buzz?
📊 The Environmental Cost of Alcohol
🚨 Water Guzzler – Producing 1L of beer takes 4-6L of water, while 1L of whiskey requires up to 50L! (WWF, 2024)
🚨 High Carbon Emissions – A single pint of beer emits 3x more CO₂ than a soft drink. (IEA, 2024)
🚨 Glass Waste Crisis – Over 60% of alcohol packaging is glass, but only 31% is recycled globally. (Recycling International, 2024)
🚨 Grape Waste in Winemaking – Wine production leaves behind 13M tons of grape waste annually. (FAO, 2024)
📌 Reality Check: That happy hour drink may have a heavier footprint than you think.
♻️ Which Alcohols Are Actually Sustainable?
✅ Organic & Biodynamic Wines – Lower pesticide use and 30% less water-intensive. (Rainforest Alliance, 2024)
✅ Local & Craft Beers – Shorter supply chains reduce emissions by 20-30% compared to imported brands. (BrewTech, 2024)
✅ Sustainable Distilleries – Brands like Glenfiddich are converting distillery waste into biofuel-powered trucks. (WhiskeyNet, 2024)
✅ Plastic-Free Spirits – Companies switching to 100% recycled glass & aluminum bottles. (EcoPackaging, 2024)
🚨 Reality Check: A wine bottle may be recyclable, but transporting it across continents isn’t exactly green.
🛑 Greenwashing in the Alcohol Industry
❌ #‘Eco-Friendly’ Labels on Mass-Produced Booze – Big brands use buzzwords but still rely on carbon-heavy production.
❌ Carbon-Neutral Claims – Some distilleries buy offsets instead of actually reducing emissions.
❌ Recyclable Bottles That Aren’t Recycled – Glass recycling rates are still low due to lack of infrastructure.
📌 Reality Check: Just because a drink is labeled ‘sustainable’ doesn’t mean it actually is.
🏆 KeyTakeaway
Green Booze could be the future with real sustainability efforts, should be focused on reducing waste & emissions, but would be another greenwashing gimmick if brands don’t take real action.
👉 Is your drink as eco-friendly as it claims to be?
SustainableAlcohol GreenBreweries EcoDistilleries CarbonNeutral CircularEconomy
Originally published on LinkedIn on 2025-02-05 05:17:13: https://www.linkedin.com/feed/update/urn%3Ali%3AgroupPost%3A2474261-7292773237057314816
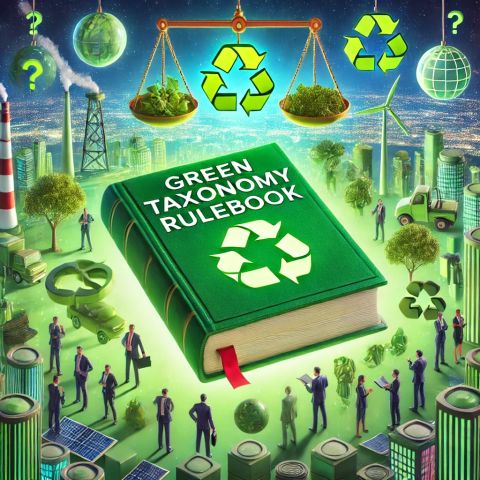
🌍 Green_Taxonomy: The Billion_Dollar_Climate_Rulebook” 📖💰♻️
Governments & investors are pumping trillions into ‘green projects’, but how do we know what’s actually sustainable and what’s greenwashing? That’s where Green Taxonomy comes in—a global rulebook defining what’s truly green.
Let’s break it down data-first.
📖 1. What is Green_Taxonomy?
✅ A classification system that defines which economic activities are truly ‘green.
✅ Prevents greenwashing by ensuring companies & funds don’t falsely claim sustainability.
✅ Guides investors & governments toward legitimate climate-friendly projects.
🚨 Why It Matters? Over $1.5 trillion in ESG investments may be at risk due to misleading green claims. (Bloomberg, 2024)
🏆 Key Impact: Governments use Green Taxonomy to shape climate policies, carbon markets, and financial incentives.
🌎 2. Global Green Taxonomies: Who’s Leading?
✅ 🇪🇺 EU Taxonomy: Strictest framework, defining what counts as green. (Source: EU Commission, 2024)
✅ 🇨🇳 China’s Green Bonds Catalog: Focuses on renewable energy & pollution control. (PBOC, 2024)
✅ 🇮🇳 India’s Green Taxonomy: Aligned with Sustainable Finance Guidelines. (RBI, 2024)
✅ 🇺🇸 US SEC ESG Rules: Weaker than EU’s, but cracking down on greenwashing. (SEC, 2024)
🚨 The Problem? Each country defines ‘green’ differently, creating market confusion for investors.
🏆 What’s Needed? A globally harmonized green taxonomy to ensure credibility & consistency.
💰 3. How Green Taxonomy Affects Business & Investments
✅ Corporations Must Report Sustainability Metrics or risk losing ESG funding.
✅ Green Bonds & Climate Finance—Only certified green projects qualify for funding.
✅ High-Carbon Industries (Oil, Gas, Cement) face stricter compliance & reporting rules.
🚨 Reality Check: #$4.2 trillion in green bonds were issued in 2023—but without strong taxonomy rules, many may not be truly ‘green.’ (Climate Bonds Initiative, 2024)
🏆 Who Wins? Companies investing in real sustainability, not just optics.
⚖️ 4. The Green Taxonomy Controversies
🔴 Is Nuclear Energy Green? 🇪🇺 The EU says YES. Critics say radioactive waste isn’t sustainable.
🔴 Is Natural Gas Green? 🇪🇺 Labeled it ‘transitional green’, sparking backlash from climate groups.
🔴 Are Carbon Offsets Valid? Many taxonomies exclude carbon credits due to verification concerns.
🚨 The Challenge? Balancing economic growth & real sustainability without greenwashing.
🏆 KeyTakeaway
The Green Taxonomy is reshaping global finance & sustainability rules. Countries that set clear standards will attract more green investments, while loopholes & weak regulations risk fueling greenwashing.
👉 Will Green Taxonomy stop greenwashing or just create more loopholes?
GreenFinance Sustainability ESG CarbonMarkets NetZero ClimateAction

Originally published on LinkedIn on 2025-01-31 08:57:08: https://www.linkedin.com/feed/update/urn%3Ali%3AgroupPost%3A100646-7291016643428704256
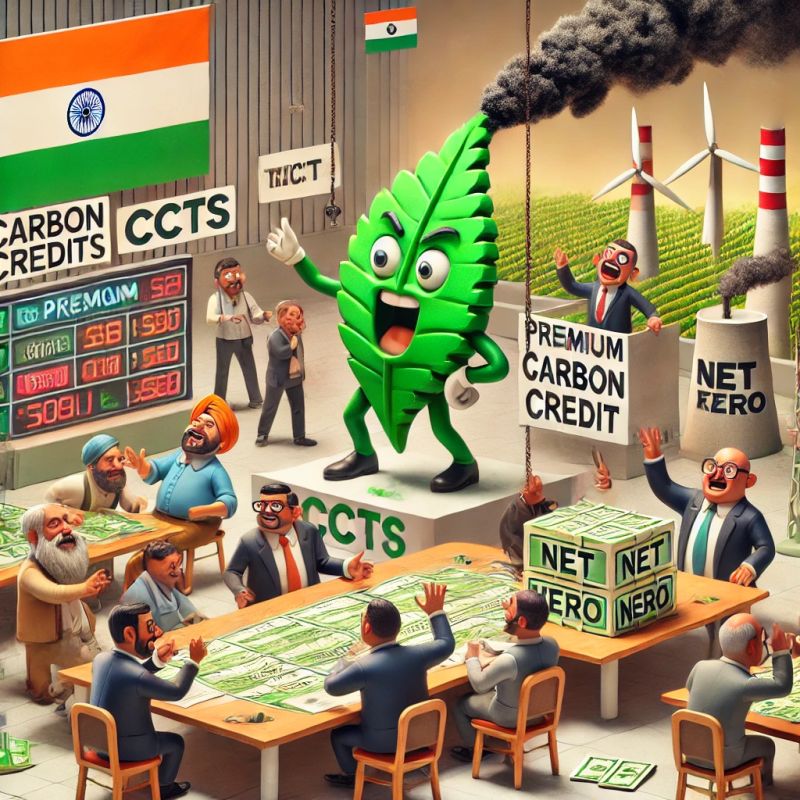
NamasteGreenIndia’s Carbon Market: A Game Changer or Just Another Framework?” 🇮🇳💨
India is making big moves in the carbon credit space with the Indian Carbon Market (ICM), but is it ready to deliver real impact? Here’s a data-driven breakdown of the Carbon_Credit_Trading_Scheme (CCTS) and what’s next.
🔍 What is the Indian Carbon Market (ICM)?
✅ Launched in June 2023 to enable carbon credit trading & cut emissions. (Source: Govt. of India, 2023)
✅ Aims to align with India’s Nationally Determined Contributions (NDCs) under the Paris Agreement.
✅ Regulated under the Carbon Credit Trading Scheme (CCTS), officially notified in June 2023 & amended in December 2023.
🏆 Why It Matters: India is one of the world’s top 3 carbon emitters, and this framework could reshape industries while driving carbon reductions.
📊 Current Status of CCTS
🛠 10 key sectors approved under the Offset Mechanism. (Source: Bureau of Energy Efficiency, 2024)
🚀 Phase 1 covers 6 sectors, with 12 methodologies developed for implementation. (BEE, Sept 2024)
🚨 Challenges:
Pricing clarity & credit validation remain uncertain.
Will industries truly cut emissions, or just buy offsets?
⚡ What’s Next for India’s Carbon Market?
📈 Expansion to more sectors, increasing carbon credit liquidity.
🌱 Stronger enforcement needed to prevent greenwashing.
🌍 Alignment with global carbon markets for international trading opportunities.
🏆 Final Verdict: High potential but execution will decide success.
KeyTakeaway
India’s Carbon Credit Trading Scheme (CCTS) could be a major climate tool, but real impact depends on strong enforcement & pricing mechanisms.
👉 Will India’s carbon market drive real change, or just be another framework?
IndiaCarbonMarket Sustainability ClimateAction NetZero CarbonCredits ESG
Originally published on LinkedIn on 2025-01-30 10:52:26: https://www.linkedin.com/feed/update/urn%3Ali%3Ashare%3A7290683269031907328
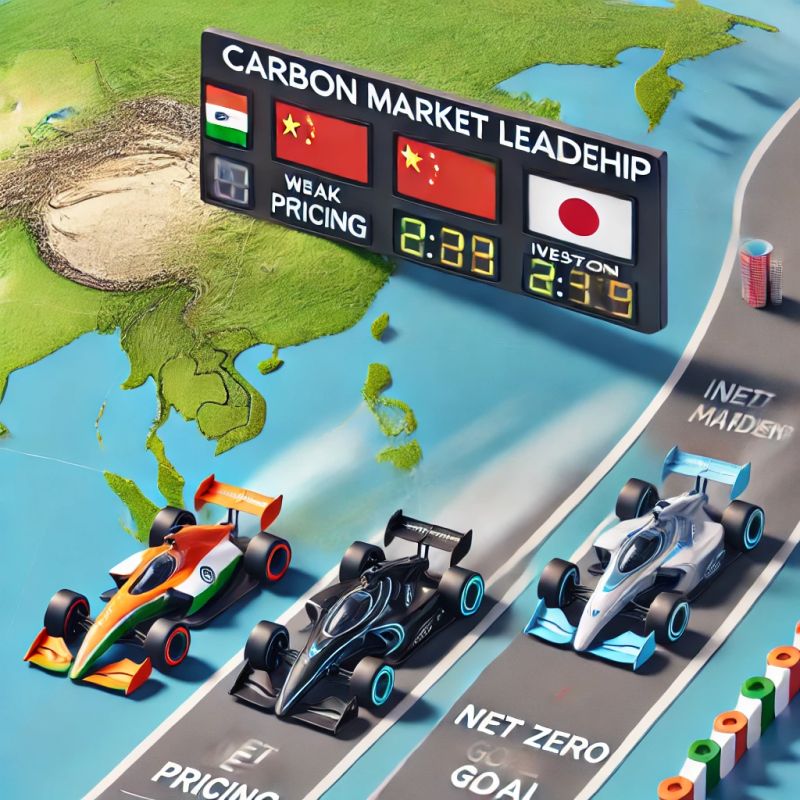
Asia’s Carbon_Market_Race: Who’s Leading and Who’s Lagging?” 🌏💨
Carbon markets are booming across Asia as nations compete to turn emissions into economic opportunities. But with different strategies at play, who’s actually making an impact, and who’s just carbon hustling? Let’s break it down data-first.
🇨🇳 China: The World’s Biggest Carbon Market
✅ Launched in 2021, covering 40% of national emissions.
✅ Expanding to heavy industries like cement & steel.
🚨 Challenge: Weak carbon pricing (~$8/ton) reduces impact. (Source: ICAP, 2024)
🏆 Verdict: Huge scale but weak incentives.
🇮🇳 India: The Emerging Carbon Giant
✅ Legislated in 2022, evolving into a regulated market.
✅ Integrating Renewable & Energy Savings Certificates by 2025.
🚨 Challenge: No firm carbon pricing yet. (Source: Ministry of Power, 2024)
🏆 Verdict: High potential, still in execution mode.
🇸🇬 Singapore: The Smart Carbon Hub
✅ Rising carbon tax from $5/ton (2022) to $50-80/ton by 2030.
✅ Pioneering biodiversity credits for ecosystem conservation.
🚨 Challenge: Small domestic market, reliant on external trading. (Source: Singapore Gov, 2024)
🏆 Verdict: Innovating beyond carbon into full environmental markets.
🇯🇵 Japan: The Tech-Driven Trader
✅ Carbon trading exchange launched in 2023 with investor backing.
✅ Banks investing heavily in climate advisory firms.
🚨 Challenge: Needs stricter corporate compliance. (Source: METI Japan, 2024)
🏆 Verdict: Strong financial backing but low enforcement
🇮🇩 Indonesia: The Controversial Play
✅ First global carbon credit transactions tied to energy projects.
✅ Huge potential from rainforests & nature-based solutions.
🚨 Challenge: Heavy reliance on fossil fuel-linked credits raises greenwashing concerns. (Source: Financial Times, 2024)
🏆 Verdict: Big opportunity, but investor skepticism is rising.
🇲🇾 Malaysia: The Carbon Market Architect
✅ Bursa Carbon Exchange (BCX) launched in 2022, first Shariah-compliant carbon trading platform.
✅ Voluntary Carbon Market (VCM) enabling corporate offsets.
✅ Carbon Tax by 2026 for high-emission industries.
🚨 Challenge: Needs stronger policy enforcement & carbon pricing clarity. (Source: PwC, 2024)
🏆 Verdict: Well-structured but awaiting execution impact.
📊 Who’s Winning the Carbon Market Race?
China = Biggest but Weak Pricing
India = High Potential, Early Stage
Singapore = Smartest Model, Small Scale
Japan = Investment-Driven, Needs Enforcement
Indonesia = High Risk, High Reward
Malaysia = Structuring Well, Needs Execution
🚀 The Future? Asia’s carbon markets must balance financial opportunities with real emission cuts—or risk becoming just another greenwashing tool.
👉 Which country’s approach will set the global standard?
CarbonMarkets AsiaLeadership NetZero Sustainability GreenInvesting ClimateAction

Originally published on LinkedIn on 2025-01-29 07:31:38: https://www.linkedin.com/feed/update/urn%3Ali%3AgroupPost%3A82951-7290270350309756931
🌟 India’s Chemical Industry: The Catalyst for Global Leadership (2025–2030) 🌟
The #$4 trillion global chemical industry is evolving rapidly, with trends like green chemistry, digital transformation, and supply chain diversification shaping its future. By 2030, the market is set to grow to #$5.5 trillion, and India has a golden opportunity to lead the charge. 🚀
Why India’s Chemical Industry is a Game-Changer
✅ Economic Engine: Contributes 7% to GDP; projected to hit 9% by 2030.
✅ Export Potential: Current exports at #$30 billion, with a target of #$60 billion.
✅ Job Creation: Can generate 2 million new jobs in specialty and green chemicals.
✅ Sustainability Leadership: Opportunity to capture 10%-15% of the #$150 billion green chemical market.
Global Trends: Challenges & Opportunities
🌍 China’s Dominance:
Controls 35% of the global chemical market.
Investing #$300 billion in green hydrogen and renewable feedstocks.
Pivoting to high-value specialty chemicals.
💡 Opportunity for India:
Reduce 33% import dependency (primarily on China).
Leverage PLI schemes for specialty and bio-based chemicals.
Build world-class chemical hubs and integrated logistics infrastructure.
📊 Global Sustainability Push:
Bio-based materials growing at a CAGR of 12%.
Over 50% of global chemical firms adopting digital supply chains by 2030.
India’s Roadmap for 2030
🔹 Market Expansion: Grow the domestic market to #$400 billion at an 8% CAGR.
🔹 R&D Investments: Increase spending to 1% of industry revenue (vs. current 0.3%-0.5%).
🔹 Skill Development: Train 500,000 professionals in green and digital technologies.
🔹 Sustainability Incentives: Develop bio-refineries and scale carbon-neutral production
The Numbers That Matter
💬 The Takeaway: India’s chemical industry is more than just a sector—it’s the foundation for sustainable growth, global competitiveness, and economic resilience. With the right policies, investments, and innovation, India can lead the global stage by 2030. 🌱
Let’s build a greener, stronger, and more self-reliant future. 💼💡
ChemicalIndustry IndiaGrowth Sustainability MakeInIndia 2030Vision
Source / shared link: https://m.economictimes.com/industry/indl-goods/svs/chem-/-fertilisers/budget-2025-chemical-industry-seeks-tweaking-in-customs-duties-to-boost-manufacturing/articleshow/117429274.cms
Originally published on LinkedIn on 2025-01-22 11:41:38: https://www.linkedin.com/feed/update/urn%3Ali%3AgroupPost%3A3880479-7287796548950745088
🚨 CorporateGovernance The Lodha Brothers’ Brand Dispute: A Case of Legacy, Law, and Leadership
🔍 Overview
The high-profile legal battle between Abhishek Lodha (Macrotech Developers Ltd.) and Abhinandan Lodha (House of Abhinandan Lodha) over the “Lodha” brand is more than a family feud—it’s a masterclass in governance, brand strategy, and crisis management.
With over ₹1,700 crore invested in marketing and ₹91,000 crore in revenues attributed to the “Lodha” brand (FY14–FY24), the stakes are sky-high. At the heart of the dispute lies a YR2017 family settlement and differing interpretations of rights to the iconic name.
⚡ Why It Matters
Brand Equity: A four-decade legacy risks dilution.
Reputation: Public disputes among business leaders erode stakeholder confidence.
Financial Impact: Rebranding, legal costs, and operational distractions loom large.
📈 Key Lessons
1️⃣ Brand Governance: Clear ownership rights and robust agreements are non-negotiable.
2️⃣ Conflict Resolution: Mediation, not litigation, protects legacy and relationships.
3️⃣ Crisis Communication: Transparent messaging is essential to maintain trust.
4️⃣ Future-Proof Agreements: Regular reviews of family/business settlements can prevent ambiguity.
🎯 What’s Next?
The Bombay High Court will hear the case on January 21, 2025. The decision could reshape how family businesses approach brand governance and conflict management.
💡 Takeaway
For leaders and boards, this dispute serves as a wake-up call: protecting legacy requires more than just great business acumen—it demands foresight, clarity, and a proactive approach to governance.
What’s your perspective on managing brand rights in family businesses? Share your thoughts below!
https://lnkd.in/diXWty7C
Originally published on LinkedIn on 2025-01-21 13:13:50: https://www.linkedin.com/feed/update/urn%3Ali%3AgroupPost%3A2153908-7287457364532695040

