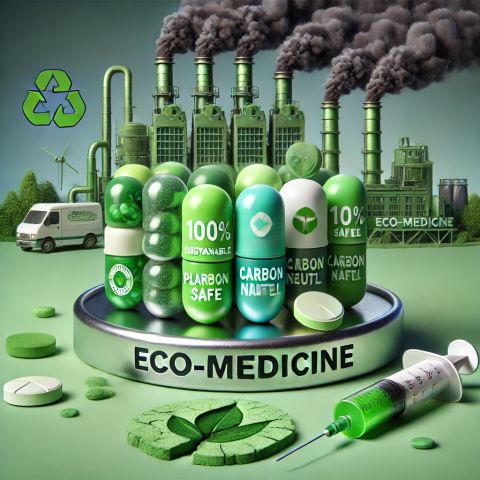
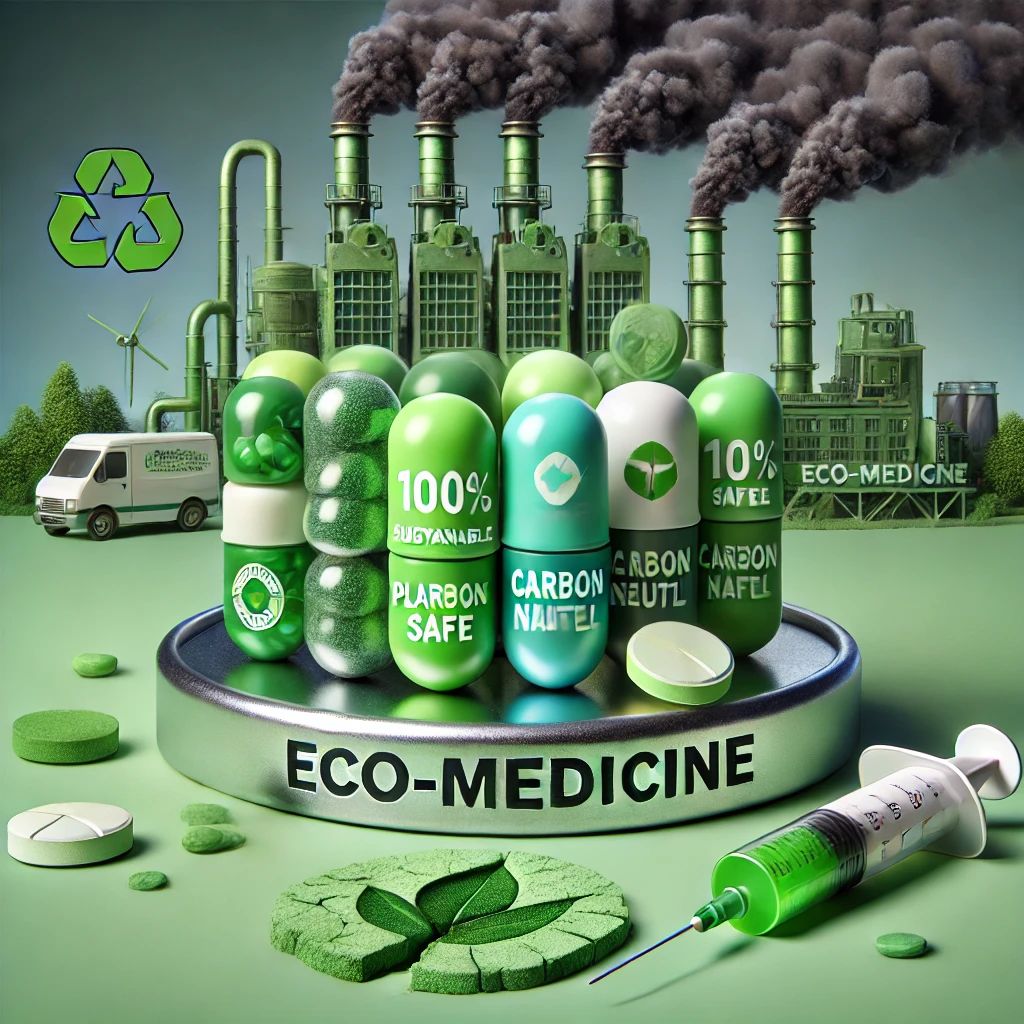
GreenwashedPills: When Pharma Prescribes Sustainability, But Swallows None of It
Green_lab_certified.
Eco_packaged.
Sustainably sourced APIs.
The claims sound clean—but the industry’s environmental footprint is anything but.
Welcome to GreenwashingInPharma, where glossy ESG reports hide toxic truths.
💊 The Industry Diagnosis:
🌍 Pharma emits 13% more CO₂ than the automotive sector (McMaster University, 2023)
🌊 Over 3,000 pharmaceutical compounds found polluting rivers globally (UNEP, 2022)
🧴 Billions of plastic blister packs are non-recyclable—despite “eco-packaging” claims
🔬 Waste incineration from expired drugs releases hazardous dioxins and furans
📉 Real Cases, Real Fines:
1. Teva Pharmaceuticals – Fined #$2.25M (USA, 2011) for violating Clean Air & Water Acts
2. Pfizer Inc. – Fined #$975K (USA, 2008) for hazardous air emissions at its Groton plant
3. Polypeptide Labs – Fined #$57K (USA, 2022) for improper waste and emission controls
4. Curia Global (AMRI) – Fined #$175K (USA, 2024) for unpermitted air emissions; also paid #$250K in community penalties
5. Merck & Co. – Fined #$1.5M (USA, 2011) for violations across air, water, and hazardous waste regulations
🚨 GreenwashingSymptoms:
🧾 CSR reports filled with offsets, not reductions
🌱 “Green APIs” with zero traceability in supply chain
⚕️ Hospitals praised for solar roofs—while sourcing drugs from polluting plants
📦 Biodegradable slogans on non-biodegradable packaging
🧠 Why This Matters:
⚠️ Greenwashing erodes public trust in an industry built on health
⛔ Improper waste disposal fuels antibiotic resistance
🌡️ Most pharma firms don’t disclose full environmental footprints
📊 70% of consumers feel misled by eco-claims in healthcare purchases
FinalThoughts:
In medicine, we demand efficacy backed by trials.
Shouldn’t we demand the same for sustainability claims?
If greenwashing becomes the prescription—
Trust is the patient we lose.
GreenwashingInPharma
CleanCuresNotCleanClaims
EcoEthicsInMedicine
ESGTransparency
PlanetOverPR
PharmaFootprint

Originally published on LinkedIn on 2025-03-25 16:59:09: https://www.linkedin.com/feed/update/urn%3Ali%3Ashare%3A7310344501275897856
NamasteGreenIndia
🌍 Biodiversity Credits: Financing a Sustainable Future 🌿
An innovative tool to bridge the $700 billion annual funding gap for global nature conservation.
🌲 Supporting Ecosystems:
The U.S. faces the risk of losing 40% of its ecosystems, while the EU protects 18% of its land through the Natura 2000 network. China safeguards 20% of its rich habitats, home to over 31,000 plant species. India, with its Western Ghats and Himalayan biodiversity hotspots, preserves habitats critical for sustaining life.
💊 Health Benefits:
Globally, 75% of cancer drugs originate from nature. The U.S., EU, China, and India rely on their diverse ecosystems to fuel traditional and modern medicine industries that save lives and drive innovation.
🌾 Food Security:
US agriculture: Relies on biodiversity for $100 billion in productivity.
EU initiatives: Preserve seed diversity for resilient food systems.
China: The world’s largest agricultural producer depends on diverse ecosystems.
India: Home to 455 crop species, ensuring food security for 1.4 billion people.
💰 Economic Value:
US ecosystems contribute $328 billion annually to GDP.
EU biodiversity fuels tourism and agriculture, driving billions in revenue.
China benefits from biodiversity in its $12 trillion economy.
India’s ecosystems generate services worth $1 trillion annually, supporting millions.
👩🌾 Supporting Livelihoods:
Natural ecosystems sustain billions:
US forests: Provide jobs to nearly 1 million people.
EU biodiversity: Empowers industries like agriculture and fisheries.
China’s resources: Support 300+ million rural residents.
India’s ecosystems: Sustain 275 million rural and tribal livelihoods.
🌟 Be Part of the Solution!
Investing in biodiversity credits is more than an environmental act; it’s a commitment to economic growth, health, and future resilience. Let’s bridge the gap and create a sustainable legacy.
💡 “Nature’s diversity isn’t just a resource—it’s our lifeline.


Originally published on LinkedIn on 2025-01-06 16:18:10: https://www.linkedin.com/feed/update/urn%3Ali%3Ashare%3A7282067935563513856
NamasteIndia checks WHO report claiming half of India’s population is physically unfit is based on extrapolations: Nadda
Let’s expand our health care comparison to include Europe China, and the UnitedStates:
1. Health Spending:
China**: Per capita health spending in China is significantly lower than in the U.S., India, and Europe.
India: India spends approximately $40 per person annually on health care.
USA: The United States allocates a staggering $8,500 per person each year.
Europe: European countries vary widely in health spending, but collectively they invest more than India and less than the U.S.
2. Health Care System Structure:
China: China’s health care system combines public and private elements, with a focus on expanding access and improving quality.
India: India’s system is decentralized, managed by states and territories, with rural access challenges.
USA: The U.S. system is complex, balancing public and private providers.
Europe: European countries have diverse systems, including single-payer models, social insurance, and mixed systems.
3. Health Outcomes and Priorities:
China: Addressing emerging diseases and financial risk protection are key priorities.
India: Improving access, especially in rural areas, remains crucial.
USA.: Despite high spending, the U.S. faces challenges in patient satisfaction and cost containment.
Europe: European nations prioritize universal access, preventive care, and equity.
Originally published on LinkedIn on 2024-08-02 18:10:16: https://www.linkedin.com/feed/update/urn%3Ali%3AgroupPost%3A60128-7225201251385266177
NamasteIndia checks WHO report claiming half of India’s population is physically unfit is based on extrapolations: Nadda
Let’s expand our health care comparison to include Europe China, and the UnitedStates:
1. Health Spending:
China**: Per capita health spending in China is significantly lower than in the U.S., India, and Europe.
India: India spends approximately $40 per person annually on health care.
USA: The United States allocates a staggering $8,500 per person each year.
Europe: European countries vary widely in health spending, but collectively they invest more than India and less than the U.S.
2. Health Care System Structure:
China: China’s health care system combines public and private elements, with a focus on expanding access and improving quality.
India: India’s system is decentralized, managed by states and territories, with rural access challenges.
USA: The U.S. system is complex, balancing public and private providers.
Europe: European countries have diverse systems, including single-payer models, social insurance, and mixed systems.
3. Health Outcomes and Priorities:
China: Addressing emerging diseases and financial risk protection are key priorities.
India: Improving access, especially in rural areas, remains crucial.
USA.: Despite high spending, the U.S. faces challenges in patient satisfaction and cost containment.
Europe: European nations prioritize universal access, preventive care, and equity.
https://lnkd.in/dwy8PrTW
Originally published on LinkedIn on 2024-08-02 18:10:09: https://www.linkedin.com/feed/update/urn%3Ali%3Ashare%3A7225201221039493120

