TheDominoesFall: UAE’s OPEC Exit Rewrites the Energy Power Equation
Dr. Anju Sharma | MrsSustainability | KtalystInsights™
KtalystGreenLove™ | A strategic lens on the new energy operating model
Energy Survival Strategy = Barrel Sovereignty × Route Security × Carbon Credibility
The UAE’s reported exit from OPEC/OPEC+ should not be read only as an oil-market event.
It is a strategic signal that the energy operating model is changing.
Shift matters because the energy transition is no longer a neat handover from oil to green. It is a complex reallocation of capital, molecules, routes, risk, and market trust.
The question for producers is no longer only:
How much can we produce?
The sharper question is:
Can we supply reliably, remain investible, defend margins, and reduce transition risk — all at the same time?
1. BarrelSovereignty: production autonomy becomes balance-sheet flexibility
✓ Qatar’s 2019 exit reflected a gas-first strategic pivot.
✓ Angola’s 2024 exit reflected quota friction.
✓ UAE’s 2026 move signals a more material shift: capacity-rich producers may not want legacy constraints on future monetisation.
So what: Energy producers with flexible capacity may be better positioned to protect market share, fund transition capex, and respond to demand volatility.
2. RouteSecurity: logistics becomes a strategic risk variable
✓ Energy security is now shaped by ports, choke points, insurance, sanctions, and naval risk.
✓ In disrupted energy traffic, passage capacity can become as important as production capacity.
So what: Buyers may increasingly price route reliability, geopolitical exposure, and delivery risk into long-term offtake and procurement decisions.
3. CarbonCredibility: market access becomes carbon-linked
✓ Future barrels may not be treated equally.
✓ Low-cost, lower-carbon-intensity barrels may gain resilience.
✓ High-cost, high-emission barrels may face a stranded-carbon discount.
4. The Ktalyst5E UAE Pressure Points
✓ Experience → Supplier Assurance
Outside OPEC: capacity confidence, not quota hesitation.
✓ Exchange → Monetisation Freedom
5 million bpd by 2027 → cash flow, market share, transition capital.
✓ Everyplace → Market Optionality
Fujairah + Murban + Asia + storage + refining → markets over meetings.
✓ Evangelism → Responsible Barrel Story
Low-cost, lower-carbon barrels need UAE’s own transition narrative.
✓ Evidence → Investible Proof
Capacity, carbon intensity, logistics, benchmark pricing, growth capex.
Bridge line:
UAE, leaving OPEC means exiting quota logic to monetise capacity before carbon, capital, and customer rules tighten.
✓ barrel is available
✓ route is reliable
✓ carbon story is credible
✓ business model remains investible
Source / shared link: https://www.wsj.com/world/middle-east/u-a-e-to-leave-opec-opec-2368bbd6?st=gPhddN
Originally published on LinkedIn on 2026-04-28 15:16:22: https://www.linkedin.com/feed/update/urn%3Ali%3Ashare%3A7454911394933694464
TheGreenShield: Why Some Economies Bend Less in Disruptions
Dr. Anju Sharma•MrsSustainability
WTI settled near $111.54/bbl after briefly touching $113.97, while Brent closed around $109.03/bbl. This is not just an oil story.
The Strait of Hormuz carries about one-fifth of global oil flows, and the IEA says about 80% of oil and oil products moving through it in 2025 was headed to Asia.
The IEA also says more than 110 bcm of LNG passed through Hormuz in 2025, nearly one-fifth of global LNG trade.
Food follows fuel. FAO says its March 2026 Food Price Index rose 2.4% month on month & Reuters’ coverage of the release notes it was about 1% above March 2025. In the same update, wheat rose 4.3% and sugar 7.2%.
FAO’s warning is duration-driven: if disruption lasts beyond roughly 40 days, fertilizer and farm-input stress can alter planting decisions and keep food inflation pressure alive into 2027.
The third shock is growth. The cleaner way to say it is not that “Asia absorbs 40% of global energy imports,” but that Asia is the main buyer at the chokepoint.
India’s crude import dependence is about 88%, Japan imports nearly all its crude, and South Korea relies on imports for almost 98% of fossil-fuel consumption. Reuters, citing ADB, says that in a disruption lasting more than a year, inflation in developing Asia-Pacific could rise by up to 3.2 percentage points and growth could fall by up to 1.3 percentage points across 2026–27.
Who bends less?
France & Spain are relatively better insulated because stronger nuclear and renewables capacity reduces gas sensitivity, according to the IMF.
US has a different shield: scale. The EIA expects U.S. crude production to average about 13.6 mb/d in 2026, and Reuters reported U.S. LNG exports hit a record 11.7 million metric tons in March 2026.
The contrast is visible in exposed economies. Reuters reports Pakistan raised diesel prices by 54.9% and petrol by 42.7%, showing how quickly fossil dependence becomes inflation stress, fiscal strain, and social pressure.
A renewable-heavy grid is not just climate policy. It is inflation defense.
Biofuels are not just transition optics. They are fuel optionality.
Nuclear is not just baseload. It is shock absorption.
Diversification is not just sustainability. It is economic design.
For years, sustainability was framed as virtue.
In 2026, it looks more like crisis insurance.
The countries that bend less when energy wars begin are not lucky. They are built differently.” Dr. Anju Sharma
Originally published on LinkedIn on 2026-04-03 22:27:00: https://www.linkedin.com/feed/update/urn%3Ali%3Ashare%3A7445960069818515458
🌍 GeopoliticalFlashFloodIndex (GFFI)3Decade 11Events
Dr. Anju Sharma | MrsSustainability | KtalystInsights
Geopolitical crises no longer move slowly. They behave like flash floods, transmitting through the global economy in a predictable sequence:
Conflict → Energy → Markets → Capital → SupplyChains
🌐 11Largest GeopoliticalShocks (1999–2024)
Ranked by Geopolitical Flash Flood Index (GFFI)
1️⃣ Russia–Ukraine War (2022) | GFFI 2.4
European gas crisis • Oil & LNG spikes • Grain disruption → inflation
2️⃣ COVID Global Shutdown (2020) | GFFI 2.3
Production freeze • Financial crash • Logistics paralysis
3️⃣ 9/11 Terror Attacks (2001) | GFFI 2.0
Market shutdown • Aviation collapse • Security restructuring
4️⃣ Iraq War (2003) | GFFI 1.8
Oil volatility • Middle East instability • Supply chain repricing
5️⃣ Saudi Aramco Abqaiq Attack (2019) | GFFI 1.7
5% global oil supply disrupted overnight
6️⃣ Crimea Annexation (2014) | GFFI 1.6
Sanctions on Russia • Energy market uncertainty
7️⃣ U.S.–China Trade War (2018) | GFFI 1.5
$350B tariffs • Supply chain migration
8️⃣ Red Sea Shipping Crisis (2024) | GFFI 1.5
Suez disruption • Insurance surge • Africa rerouting
9️⃣ Arab Spring Oil Disruptions (2011) | GFFI 1.4
Libyan oil collapse • Brent spike
🔟 Kosovo War (1999) | GFFI 1.3
NATO intervention • European instability
1️⃣1️⃣ Israel–Hamas War (2023) | GFFI 1.3
Middle East risk premium • Energy shipping risks.
📊 What 3DecadeData Reveals
1️⃣ Energy transmits the shock first
~30% global seaborne oil via Hormuz
~12% global trade via Suez
~20% LNG through Middle East routes
Energy shocks rapidly become inflation shocks.
2️⃣ Markets before governments
Markets reprice geopolitical risk within hours. Policy responses follow weeks later.
Financial volatility becomes the first alarm system.
3️⃣ SupplyChains move slowest
Structural adjustments take years, not months:
Europe’s gas diversification after 2022
China+1 manufacturing shift
Red Sea reroutes adding 10–15 days
Resilience competes with efficiency.
Geopolitical crises rarely destroy companies, execution dysfunction does. Resilient organizations practice five strategic habits:
✔ Signal Intelligence – treat energy, freight, insurance spikes as early signals
✔ Scenario Discipline – rehearse geopolitical shocks in advance
✔ Coordinated Execution – align finance, procurement, logistics
✔ Networked Supply Chains – multi-route sourcing and logistics
✔ Margin Strategy – protect pricing power and portfolio resilience
The difference between crisis and opportunity is reaction speed.
GFFI Geopolitical Flash Flood Index
GFFI = 0.30E + 0.25M + 0.20C + 0.20S + 0.05P
E = Energy Shock
M = Market Repricing
C = Capital Rotation
S = Supply Chain Impact
P = Policy Lag
Higher score, faster systemic disruption. ( for Customized versions ping us)
Originally published on LinkedIn on 2026-03-04 06:29:35: https://www.linkedin.com/feed/update/urn%3Ali%3Ashare%3A7434847493542039552
People, Planet & Profit
First_among_equals Policy
Dr. Anju Sharma | MrsSustainability
The LNG scramble is also one of the clearest stress-tests of modern energy diplomacy—where the US + EU + Middle East + Russia are all trying to balance the same two levers: Policy + Profit, while the rest of the world navigates the volatility they create.
1. PEOPLE ⚡️ (the “no blackouts” mandate) ✓ Europe’s gas storage fell to about 44% (late Jan 2026) vs a 10-year average ~58% — lowest winter level since 2022.
✓ If withdrawals stay harsh, storage could drop to ~30% or lower by March — meaning a brutal refill season ahead.
❌ When security tightens, it’s households + SMEs who feel the “price-weather” first.
KtalystKlue: Energy security isn’t a slogan — it’s a social contract. And social contracts get priced.
2. PROFIT 🧾 (who’s earning the “green dollars”?) ✓ In Jan 2026, the US supplied ~60% of EU LNG — around 5.36 million tonnes (Kpler-tracked) — one of the biggest monthly flows on record.
✓ In 2025, US LNG was ~58% of EU LNG (up ~4× vs 2021), sparking EU warnings about “dependency swap.
❌ Translation: Europe escaped one chokepoint… and walked into another priced as “flexibility.
KtalystKlue: Flexibility is not free. It’s an “option premium” — and someone always monetizes the option.
3. POLICY 🏛️ (the real pipeline is the rulebook) ✓ EU policy is still compressing Russian influence: Russia’s share in total EU gas imports fell to ~12% in Q2 2025 (from 18% a year earlier). (European Commission)
✓ EU is also explicitly moving to phase out Russian gas entirely by 2027, increasing the need for LNG + storage discipline.
❌ Markets can ignore speeches — but they don’t ignore laws, targets, and penalties.
KtalystKlue: Policy doesn’t “support” markets. Policy creates markets — and decides who gets paid.
4. PLANET / PLANT 🌿 (is it actually green?) ✓ Carbon is now a hard price signal: analysts forecast EU carbon allowances averaging ~€92.65/tonne in 2026. (Reuters)
✓ When renewables underperform, gas burn rises — the International Energy Agency has explicitly flagged higher gas burn during periods of lower renewable output in Europe.
❌ So LNG can be a transition stabilizer… but it can also become a profit machine if dependency gets locked in.
KtalystKlue: Decarbonization is the direction. “Greener invoices” are not the destination.
So who’s earning and who’s paying?
✓ Earners: liquefaction owners, shippers, terminal operators, traders (the “toll collectors” of flexibility)
❌ Payers: households + industry via volatility, plus governments via security subsidies
If you want a one-line truth for 2026:
Sustainability sets the constraints. Profit hunts the spreads. Policy picks the winners.
Question for comments:
Are we watching global decarbonization… or global monetization of insecurity? 👇
KtalystInsights™ KtalystKlues™ MrsSustainability LNG EnergySecurity Geopolitics GasMarkets PolicyRisk TransitionEconomics
Originally published on LinkedIn on 2026-01-31 08:29:17: https://www.linkedin.com/feed/update/urn%3Ali%3Ashare%3A7423281206324252672
✈️ When_Indi_No_Go:
Dr. Anju Sharma ESG_POV (with a Devil’s Advocate Lens)
1️⃣ The ESG Lens: Resilience Is Compliance
December 2025 proved ESG isn’t “extra paperwork.” IndiGo hit a Social + Governance stress test, not a technical glitch.
✓ Social: Rested pilots = safety device. Families on floors = “S” warning.
✓ Governance: FDTL wasn’t a surprise; buffers were mandatory.
✓ Environmental: The only silent stakeholder.
Devil’s Advocate:
Is this ESG failure or ESG language applied to a classic capacity + complexity miscalculation across the ecosystem?
2️⃣ What Was Said vs What Was Heard
CEO & Chairman were unusually honest “blemish,” “regret,” “nothing engineered.
They admitted:
✓ Roster transition gaps
✓ Underestimating fatigue rules
✓ Hiring slower than scheduling
✓ Weather + tech + congestion as multipliers
✓ Early board involvement
✓ External audits
DGCA responded:
✓ Officers at IndiGo HQ
✓ Real-time oversight of fatigue, rosters, refunds
✓ 10% schedule cut for stability
Devil’s Advocate:
If FDTL was known, did IndiGo alone misjudge?
Or did regulator + airports + India Inc’s growth bias underestimate the hit on lean systems?
Numbers:
✓ 3,000–4,000 flights disrupted
✓ Refunds > ₹1,100 crore (≈ USD 132M)
✓ DGCA embedded
✓ 10% flight cut mandated
Takeaway:
No villain just a pile of “we’ll manage” assumptions collapsing together.
3️⃣ MyPOV: A Governance Reality Check, Not an Ops Failure
Aviation held up a mirror to India Inc.
✓ Worship of lean staffing
✓ Scale mistaken for immunity
✓ Optimistic scheduling
✓ Adjustable compliance mindset
✓ Regulators expected to accommodate
IndiGo forgot a foundational rule:
Redundancy isn’t inefficiency — it’s resilience. With ~60% market share, you’re critical infrastructure, & such systems fail visibly, not quietly.
Devil’s Advocate:
Have we over-romanticised “lean” while ignoring that buffers, backups & boredom are the real foundations of resilience?
4️⃣ The GeopoliticalAmplifier
Aviation never sits outside geopolitics. In 2025:
✓ Middle East corridor shifts
✓ Engine & spare-part constraints
✓ China–EU–India delivery delays
✓ Fuel volatility
✓ Pilot shortages
✓ Winter expat surges
The Real Question:
✓ Did global turbulence amplify IndiGo’s fragility?
or
✓ Did thin internal margins exaggerate normal pressures?
Devil’s Advocate:
Are we blaming “geopolitics” because it sounds smart when the real issue is running hot, fast, and thin?
5️⃣ Final Thought: The Exam Isn’t for IndiGo, It’s for India Inc
IndiGo promises “actions, not words.
But the bigger question: Are Indian industries flying too close to the sun on lean staffing, fragile systems, and optimism-led planning? The next rule safety, labour, data, climate, carbon won’t check readiness. It will test it.
Devil’s Advocate:
Is your business truly resilient
or one regulation away from its own Indi-No-Go moment?
Originally published on LinkedIn on 2025-12-11 05:27:00: https://www.linkedin.com/feed/update/urn%3Ali%3AgroupPost%3A121193-7404753548846272512
KtalystInsights 6Lenses of a Sustainable Growth Ecosystem
A Ktalyst Lens on Global Value Leadership
The Ktalyst Lens reminds us that growth and sustainability must move together. Beyond numbers and policies, the true path to value leadership lies in viewing economies through six critical lenses—Energy Security, Carbon Finance, Digital Monetisation, Circular Economy, Geopolitical Competitiveness, and Inclusive Growth.
When we rate the world’s top economies—US, China, NamasteIndia, Japan, and Germany—across these lenses, it becomes clear: each nation has unique strengths, blind spots, and opportunities. The future of sustainable growth will be shaped not by who grows fastest, but by who balances these six lenses best.
🌞 Energy Security
US ★★★★★ (exporter)
China ★★☆☆☆ (70%+ imports)
India ★★☆☆☆ (85% oil import)
Japan ★★☆☆☆ (import dependent)
Germany ★★☆☆☆ (import dependent post-Russia)
🌍 Carbon Finance
Germany ★★★★★ (ETS, high prices)
US ★★★★☆ (IRA subsidies)
Japan ★★★☆☆ (hybrid trading)
China ★★☆☆☆ (USD 8/ton ETS)
India ★★☆☆☆ (USD 5–8/ton credits)
📱 Digital Lens (Data Monetisation)
US ★★★★★ (70% global ad revenue)
China ★★★★★ (WeChat, Alibaba, TikTok)
India ★★☆☆☆ (800M users, <10% monetisation local)
Japan ★★★☆☆ (advanced but localised)
Germany ★★★☆☆ (strong tech, less global platforms)
♻️ Circular Economy
Germany ★★★★★ (>50% recycling)
Japan ★★★★★ (>50% recycling)
US ★★★☆☆ (~32% recycling)
China ★★★☆☆ (fast-growing recycling)
India ★★☆☆☆ (15–20% e-waste recycled)
🌐 Geopolitical Competitiveness
US ★★★★★ (innovation + finance control)
China ★★★★★ (manufacturing + supply chains)
Germany ★★★★☆ (high-tech exports)
Japan ★★★★☆ (efficiency + technology)
India ★★★☆☆ (youth + digital, rising edge)
👥 Inclusive Growth
Germany ★★★★★ (social equity)
Japan ★★★★★ (equity, aging challenge)
US ★★★☆☆ (innovation but inequality)
China ★★★★☆ (state-backed inclusion)
India ★★★☆☆ (MSMEs strong but low credit access)
Sustainability isn’t an add-on—it’s the business model. The 6 Lenses aren’t just metrics; they are the ecosystem map to value leadership.” Dr. Anju Sharma
📌 KtalystInsights
Originally published on LinkedIn on 2025-08-20 01:46:25: https://www.linkedin.com/feed/update/urn%3Ali%3AgroupPost%3A2474261-7363748208654667777
KnowledgeKtalyst BorderlineEconomics
TariffTantrums: Dishoomm! Wrackkkk! Welcome to
Tariffs don’t just tax goods—they throw punches across borders and rewrite the rules of global rivalry.
KtalystKeystone
⚔️ BAM! TariffsAsTactics
No longer boring fiscal tools—tariffs are now actionheroes of geopolitics. From steelslugfests to solarsmashes, every hike is a headline.
🌐 CRASH! GlobalSupplyGridlock
Container reroutes, productdelays, pricingchaos. When giants clash, supplychains duck and dive to survive.
💼 ZAP! BusinessUnusual
Margins shrink, strategies flip! Businesses now redesignproducts, repriceSKUs, and shift entire geographies overnight.
♻️ WHOOOSH! GreenTariffsGrow
CBAM enters the ring! Carbon is the new currency—polluterspay, innovatorsplay. A sustainable slugfest begins.
⚖️ CLANG! WTOWatch
WTO courts are buzzing. From sugar to semiconductors, the number of disputes is breaking records—and patience.
BOOM! 2025 in Numbers
134percent avg hike in India’s retaliatoryduties
125percent max UStariff on Chinesegoods
EUR75–90/ton CBAM impact on EU-bound cement & steel
78 active WTOdisputes—highest in a decade
So What?
This isn’t just trade—it’s globaldrama on a fiscalbattlefield. The world isn’t building walls—it’s erecting tarifftowers.
Stay tuned as KtalystKeystone unpacks the next plot twist in BorderlineEconomics


Originally published on LinkedIn on 2025-04-11 18:20:30: https://www.linkedin.com/feed/update/urn%3Ali%3AgroupPost%3A4023031-7316525567799918592
Protectionism is temporary. Strategy is forever.” – KtalystKeystone
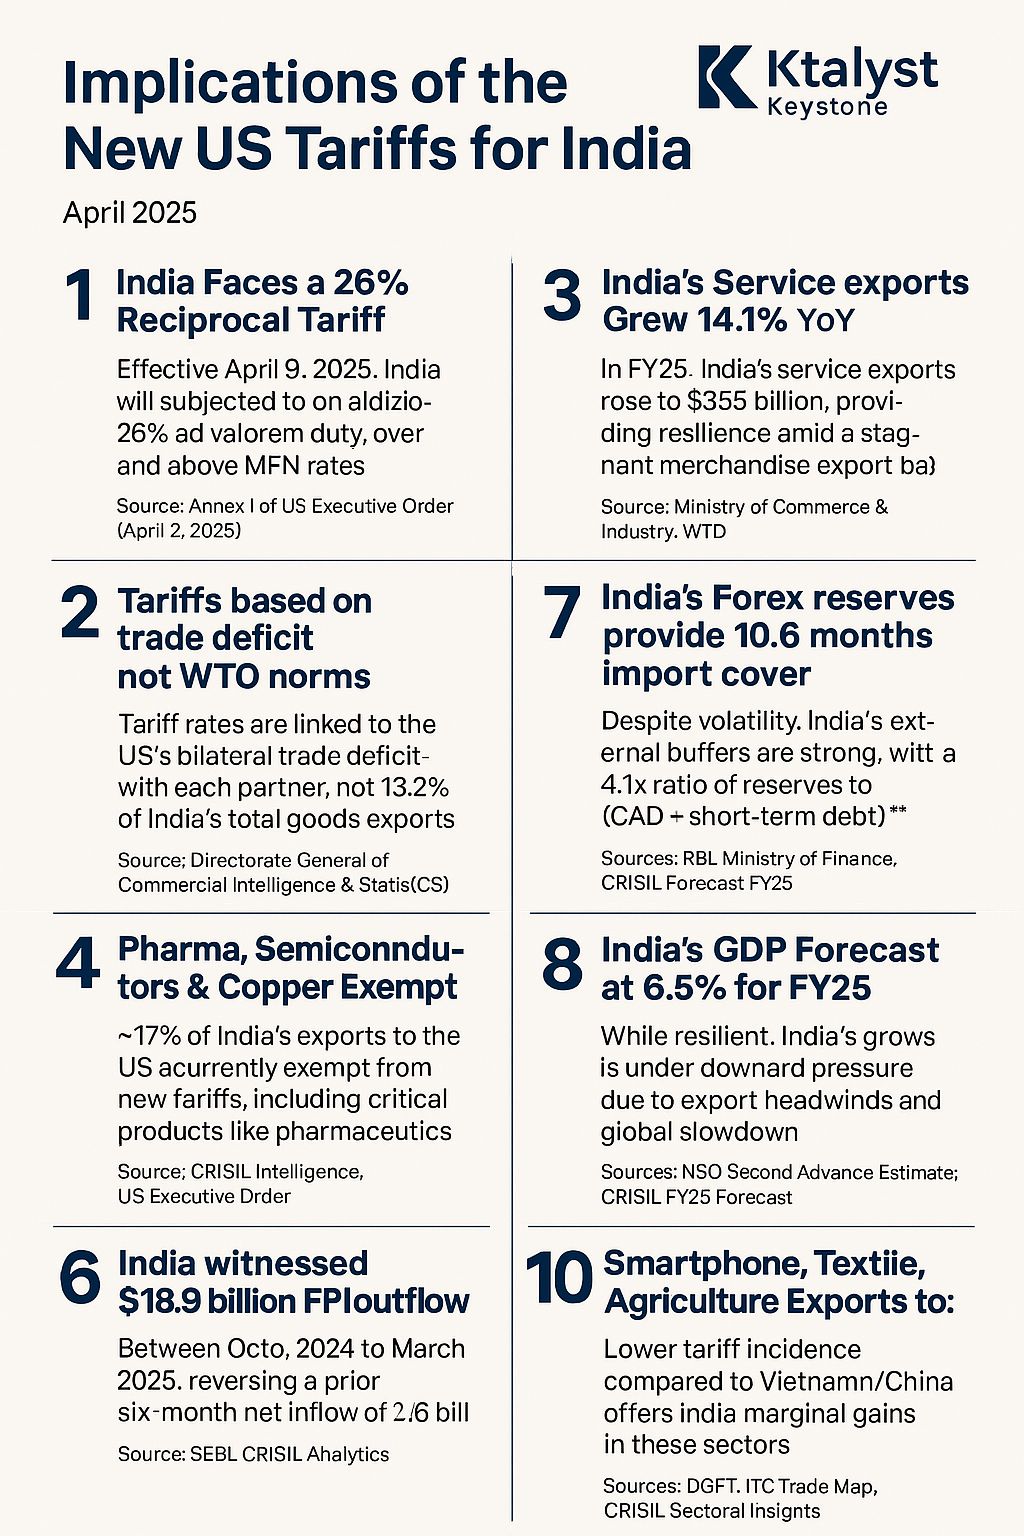
Insights from the April 2025 CRISIL Report on US Tariffs & India:
The 26% tariff isn’t just a tax — it’s a test. A test of India Inc.’s resilience, agility, and strategic depth.
India’s export engines may sputter, but its services superpower and domestic strength are the new fuel.
StrategicViewpoint | What IndianBusinesses Must Do Now
🔍 RethinkExportDependency
High-risk sectors like GemsAndJewellery (with 37% exports to US) must unlock new geographies — EU, GCC, ASEAN.
📦 LeverageServicesBoom
With service exports clocking 14.1%YoY growth, the pivot to digital, consulting, and R&D is more than necessary — it’s non-negotiable.
⚙️ LocalizeValueChains
Auto and Electronics firms must evaluate USMCA partnerships and nearshoring to maintain tariff competitiveness.
📈 HedgeWisely
$18.9B of FPI outflows signal clear volatility. CFOs, it’s time to sharpen your forex strategy and revisit pricing models.
🛡️ UseIndiaPolicyCushion
The PLI schemes, ongoing capex push, and FTA progress (esp. with UK & EU) can soften the blow.
🌱 StayResilientStayStrategic
India’s #$355B service exports, 10.6 months import cover, and low CAD are not just stats — they’re shock absorbers.
KtalystKeystone | CatalysingStrategy in Disruptive Times
TradePolicy GlobalMarkets IndiaUS TariffWatch Exports Geopolitics MakeInIndia KtalystPerspective LinkedInPulse

Originally published on LinkedIn on 2025-04-08 17:38:16: https://www.linkedin.com/feed/update/urn%3Ali%3AgroupPost%3A2153908-7315427778760183808
NamasteINDIA Builds Forward: Fast-Tracked Firepower & Indigenous Intent
While global powers are expanding their defence arsenals, India has taken a strategic leap—approving ₹54,000 crore (~$6.5 billion) in defence acquisitions aimed at indigenousmodernisation, speed, and combatreadiness.
Approved by the DefenceAcquisitionCouncil (DAC), chaired by Defence Minister RajnathSingh, the package includes:
🛡️ T-90 Tank Upgrades – New 1350 HP engines for high-altitude mobility
✈️ AEW&C Aircraft – Enhanced aerial surveillance & battlefield awareness
⚓ Varunastra Torpedoes – Indigenous underwater defence power
⏩ Procurement Reform – Timelines slashed from 96 weeks to just 24!
How India’s Move Stands Globally
🇺🇸 USA – $886B | AIwarfare, cyberdominance, spacedefence
🇨🇳 China – $225B+ | navalbuildup, hypersonicmissiles, Taiwanfocus
🇷🇺 Russia – $109B* | Ukrainewar, missilesystems, nuclearreadiness
🇮🇳 India – $6.5B (this package) | MakeInIndia, fasttrack, strategiccapability
🇯🇵 Japan – $53B | longrangemissiles, IndoPacificstrategy
🇬🇧 UK – $65B | AUKUS, AIwarfare, nucleardeterrence
🇫🇷 France – $50B | aerospacedefence, NATOreadiness
🇩🇪 Germany – $54B (+€100B boost) | Bundeswehrrevamp
🇰🇷 South Korea – $50B | smartweapons, regionaldeterrence
🇮🇱 Israel – $25B | dronetech, IronDome, defencetechexport
(*Unofficial Russian spend likely higher)
Why It Matters
#✅ Speed over red tape – from 96 weeks to 24
#✅ Self-reliance over imports – MakeInIndia in action
#✅ Strategic autonomy over dependence – DefenceResilience for the future
India is not just responding to global trends—it’s redefining them.
In a volatile, tech-driven, multi-threat world,
Speed + IndigenousStrength = StrategicEdge
NamasteIndia | AtmanirbharBharat | DefenceDeals | NationalSecurity
MilitaryModernisation | Geopolitics | StrategicAutonomy
IndiaRising | InnovationInDefence | KtalystKeystone
Rs 54,000 CRORE Defence Deals! T-90 Upgrades, AEW&C Aircraft, Varunastra Torpedoes – DAC Cuts Procurement Timelines
https://lnkd.in/dazdutm4
Download the Times Now app now:
https://lnkd.in/dsbKUgX3
Originally published on LinkedIn on 2025-03-24 05:30:54: https://www.linkedin.com/feed/update/urn%3Ali%3Ashare%3A7309808913678278657
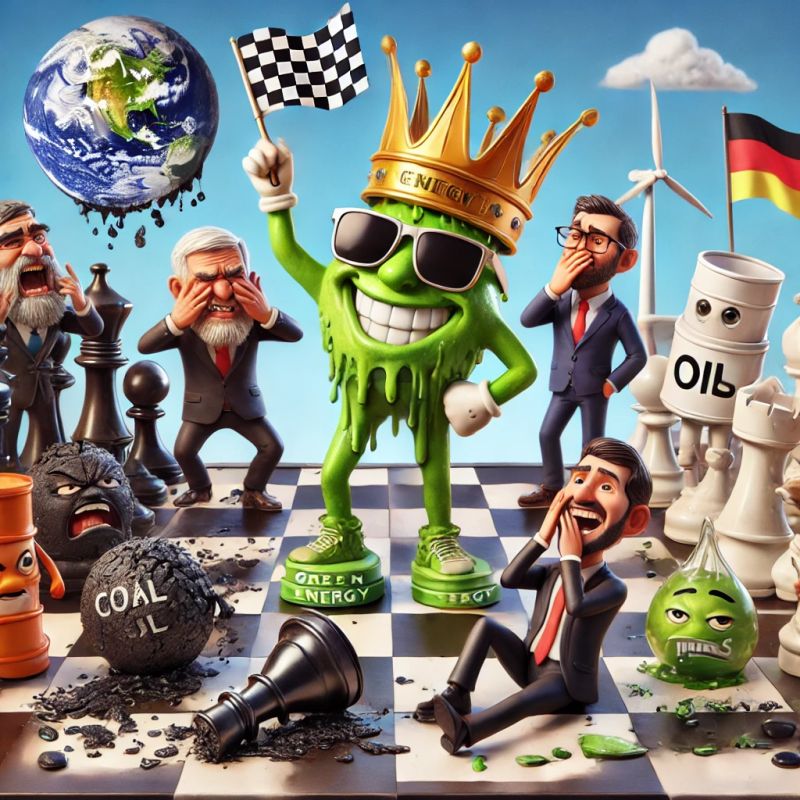
Is Green the New_Global_Superpower? How Climate Policies Are Reshaping the World” 🌍♻️🏛️
Climate policies are no longer just about saving the planet—they’re reshaping global politics, economies, and power dynamics. Welcome to the era of Green Political Global, where sustainability is the new currency of influence.
🌱 1. Is Climate the New_Geopolitical_Weapon?
✅ Carbon Tariffs & Trade Rules: The EU’s Carbon Border Adjustment Mechanism (CBAM) is forcing nations to cut emissions or pay the price.
✅ Green Trade Wars: Countries are using climate policies to favor domestic industries, from EV subsidies to clean energy export bans.
🚨 Who’s Winning? The US, EU, and China lead the green tech race, while developing nations struggle with compliance costs.
💰 2. Is Green Finance Replacing Oil Money?
✅ #$1.5 Trillion in ESG Investments: Global funds are shifting capital toward sustainable projects. (Source: BloombergNEF, 2024)
✅ Debt-for-Nature Swaps: Countries like Ecuador and Belize are cutting debt by committing to climate conservation.
🚨 Who’s Losing? Fossil-fuel-dependent nations risk economic isolation if they don’t transition fast enough.
⚡ 3. Who Controls the Future Energy Chessboard?
✅ China dominates solar & battery production, controlling 80% of global supply chains. (Source: IEA, 2024)
✅ US and EU investing billions in green hydrogen & rare earth mining to reduce dependence on China.
🚨 Who’s at Risk? Countries reliant on coal & oil exports face declining demand, reshaping global alliances.
🚀 4. Is Climate Politics the New Kingmaker?
✅ Green Politics is Winning Elections: Climate-focused leaders are gaining ground in Europe, the US, and Latin America.
✅ Corporate Influence Growing: Tech giants and carbon credit billionaires are shaping global climate policies.
🚨 Who’s Losing? Traditional fossil industries face increasing policy restrictions and legal battles.
🏆 KeyTakeaway
Climate policy is no longer just science—it’s global strategy. Nations that control green tech, finance, and trade rules will dominate the next economic era.
👉 Is your country leading the Green Power Shift, or falling behind?
ClimatePower Geopolitics GreenEconomy NetZero Sustainability FutureOfEnergy
Originally published on LinkedIn on 2025-01-30 11:06:32: https://www.linkedin.com/feed/update/urn%3Ali%3AgroupPost%3A2635374-7290686820978233345

