IndustrialWars Built Empires.
EnergyWars Are Shaking Them.
Dr. Anju Sharma | MrsSustainability | KtalystInsights™
CheapEnergy built industrial giants.
VolatileEnergyCost is compressing margins.
The repricing is visible:
🔋 1,000+ GWh annual EV battery installs
📉 ~90% battery cost collapse (2010–2025)
☀️ Renewables = cheapest new power in ~80% of markets
🌍 ~4,400 GW global clean capacity installed
⚡ Electrification accelerating across steel, chemicals, transport
CostCurves don’t negotiate.
They redistribute power.
What’sCompounding
✓ Battery packs near $100/kWh → adoption inflection
✓ Solar LCOE below new coal/gas (India, US, China)
✓ US IRA deploying $300B+ clean capital
✓ India adding 30–50 GW renewables annually
✓ China controlling 55%+ battery installations
✓ Industrial electrification improving margin efficiency
Scale concentration → profit concentration.
What’sConstraining
✗ Grid bottlenecks slowing deployment
✗ Storage lag vs generation growth
✗ >90% hydrogen still fossil-derived
✗ Synfuels at 3–5× fossil cost
✗ Trillions in fossil asset exposure
✗ Policy speed > infrastructure speed
Headlines move fast.
Factories move slower.
🌍 BlocPowerMatrix
🇨🇳 China → Battery + solar manufacturing density | Trade exposure
🇺🇸 US → Capital velocity (IRA) + biofuels | Policy reversal risk
🇪🇺 EU → Regulatory enforcement (CBAM) | Industrial competitiveness pressure
🇮🇳 India → Stack pragmatism (EV ~8%, 140+ GW solar, E20) | Execution velocity
KtalystKlues
Energy wars reward execution clusters — not ambition.
GreenLove Is No Longer CSR
Whether for Currency or CarbonFootprints, it is now:
1️⃣ Carbon / EBITDA ratio → tariff & disclosure risk
2️⃣ Energy mix / revenue → volatility multiplier
3️⃣ Capex alignment → stranded vs scalable assets
EnergyVolatility × CarbonExposure × ExecutionLag
= Valuation discount.
That’s the equation.
KtalystInsights™ | 5Ps × 5Es Alignment
5Ps — Strategic Pressure Points
✅ People — skills & productivity
✅ Profit — margin resilience
✅ Planet — emissions credibility
✅ Policy — compliance exposure
✅ Politics — energy security & trade risk
5Es — Industrial Drivers
✅ Energy — secure, diversified, decarbonising mix
✅ Efficiency — intensity per unit output
✅ Economics — cost curve positioning
✅ Execution — deployment velocity
✅ Ecosystem — supplier + grid integration
Misalignment compounds risk.
Alignment compounds advantage.
TheDecadeEquation
Industrial wars aligned:
Cost + Infrastructure + Capital.
Energy wars demand alignment of:
Carbon + Capital + Control.
Green-only-carbon → red-in-cash.
Cash-only-green → red-in-policy.
GreenLove = both.
NamasteIndia is stacking.
China is scaling.
EU is regulating.
US is capitalizing.
Execution decides power.
EnergyTransition Geoeconomics IndustrialStrategy DataComa
Originally published on LinkedIn on 2026-02-11 11:39:13: https://www.linkedin.com/feed/update/urn%3Ali%3AgroupPost%3A1910576-7427315268017844225
📊 KtalystInsight | Inflation: Who StayedGreen When the World Paid?
🌍 A global reset decoded — with flags, facts & fiscal firepower
InflationWatch GeoEconomics KtalystKeystone
💥 Between 2022 and 2024, inflation was the uninvited global guest.
Some economies panicked.
Others pivoted, performed, and profited.
So, who made the most of the macro mess?
🏆 The Strategic Winners
(Not just survivors — system optimizers.)
🔹 🇮🇳 India | 6.7% → 2.8%
→ Digital public infra (UPI, DBT), FDI magnet, fiscal discipline
🔹 🇺🇸 USA | 8.0% → 2.35%
→ Soft landing playbook, textbook Fed moves, labor resilience
🔹 🇪🇺 Eurozone | 8.4% → 2.4%
→ ECB calibration, energy reorientation, united policy front
🔹 🇬🇧 UK | 11.1% → 2.3%
→ Tackled wage spiral, central bank credibility rebuilt
🔹 🇧🇷 Brazil | 10.1% → 3.6%
→ Commodity export surge, inflation dipped with discipline
🔹 🇸🇦 Saudi Arabia | 3.2% → 1.6%
→ Oil windfall = Vision 2030 funding + sovereign muscle
🔹 🇮🇩 Indonesia | 5.5% → 2.8%
→ Nickel & EV boom, food security, smart monetary strategy
🔹 🇷🇺 Russia | 13.8% → 6.0%
→ Energy rerouting, currency lockdown (short-term buffer only)
🚨 The Strugglers
(Where inflation exposed institutional cracks.)
🔻 🇹🇷 Turkey | 64% → 70%+
🔻 🇦🇷 Argentina | 72% → 140%+
🔻 🇱🇧 Lebanon | 170%+ collapse
📉 Currency freefall.
📉 No policy credibility.
📉 Public trust: vanished.
💬 Ktalyst Quote Drop
> “Productivity isn’t everything, but in the long run it’s almost everything.
Paul Krugman
📌 The real gainers?
Those who treated inflation not as an excuse — but a trigger for transformation.
🎯 KtalystTakeaway
✔️ Inflation was universal. Response wasn’t.
✔️ Strategy, systems, and digital delivery = real differentiators.
✔️ Macro maturity > monetary panic.
📝 Note:
We’ve used actual inflation ranges (2022–2025) instead of arrows (⬆/⬇) to show clear, measurable trends — because in policy and business, data speaks louder than symbols.
Originally published on LinkedIn on 2025-06-15 05:54:40: https://www.linkedin.com/feed/update/urn%3Ali%3AgroupPost%3A82951-7339893086929444865
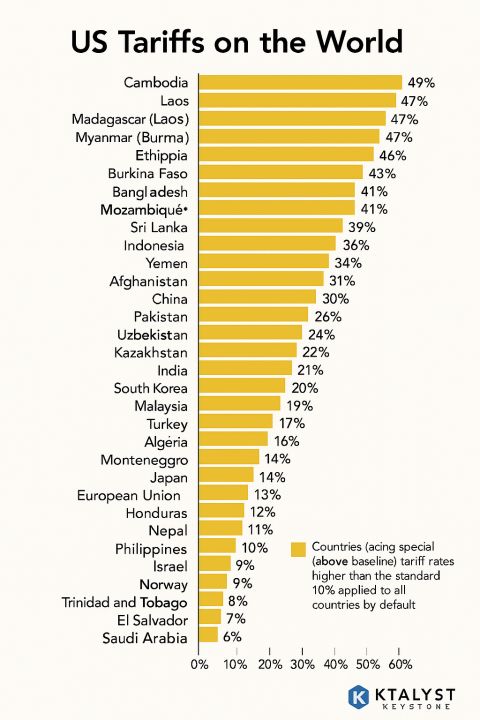
USATariffs: When_Free_Trade_Gets_Its_Price_Tag_Replaced
Tariffs aren’t about protection. They’re about projection — of power, preference, and prejudice.
KtalystKeystone
This infographic may look harmless, but it’s a masterclass in modern diplomacy — coded in percentages and padded with politeness.
The US tariff map doesn’t show trade. It shows trust. Or the lack of it.
How the world’s reacting? With quotes, quips, and quiet recalibrations:
🧘♂️ Narendra Modi: “Trust-based global supply chains cannot run on selective penalty cards.
🗽 JoeBiden: “We support free and fair trade… especially when it’s fair to us.
💶 ChristineLagarde (₹ECB): “Trade restrictions rarely deliver economic resilience. But they do deliver headlines.
🌍 NgoziOkonjo-Iweala (WTO): “Tariffs are the tax poor countries pay for not being geopolitically relevant.
📊 PwC Trade Outlook 2024: “Tariffs are no longer just economic instruments — they are policy emojis.
🧾 KPMG Global Advisory: “Companies now factor ‘tariff volatility’ the way they used to factor weather.
🧠 Deloitte Insights: “Tariff regimes are shaping new hubs, routes, and risk appetites — data is the only antidote.
📘 EY Global Strategy: “When tariff maps become strategy guides, you know diplomacy has turned digital.
What’s really going on?
A covert cartography of who’s in favour, who’s in trouble, and who’s too big to tax.
Cambodia pays 49%. The UK? 10%.
So yes, we believe in equality — just differently applied.
At KtalystKeystone, we don’t just crunch data. We decode its intent.
Because if you’re playing in global markets without understanding its mood swings, you’re just guessing in a poker game.
Ask yourself: Are you navigating trade — or being nudged by it?
The invisible ink of tariffs has become the loudest voice in global policy.
Time to read between the rates.

Originally published on LinkedIn on 2025-04-04 10:58:43: https://www.linkedin.com/feed/update/urn%3Ali%3Ashare%3A7313877676639842305

