When CONflict Becomes the Fastest ClimatePolicy
Dr. Anju Sharma | MrsSustainability | KtalystInsights
The GreenTransition is often framed as a story of conscience activism, ESG mandates & climate policy.
History suggests something less comfortable.
Geopolitical instability may be the most powerful venture capitalist of the energy transition.
The tensions around the Strait of Hormuz are not just another regional crisis. They represent a global price reset in energy risk.
War does not only destroy economies. It reprices EnergySystems.
When fossil fuels begin reflecting their true security risk, transition economics do not slowly evolve.
They flip.
The GeopoliticalFlashFlood
The Strait of Hormuz carries:
✔ ~20% of global oil flows
✔ ~33% of global LNG trade
For NamasteIndia, the exposure is enormous.
✔ ~66% of crude imports transit this chokepoint
✔ ~50% of LNG flows through this corridor
Even before disruption occurs, markets price risk.
This becomes the WarPremium a geopolitical tax on fossil fuels.
MacroImpact
A sustained 10% rise in crude can add ~0.3 percentage points to India’s CPI while widening the trade deficit.
Every oil shock quietly improves the economics of solar, wind and electrification.
Renewables: From Ideology → Security Hedge
In stable markets, renewables are framed as climate solutions.
In volatile markets, they become strategic assets.
Fossil systems remain exposed to:
❌ spot price shocks
❌ shipping chokepoints
❌ geopolitical leverage
Renewables operate differently:
✔ fuel-free generation
✔ predictable cost curves
✔ domestic energy supply
Once volatility crosses a threshold:
The GreenPremium disappears.
It becomes a Security Discount.
India’s Strategic Energy Shift
India imports roughly 88% of its crude oil. Every oil shock triggers a familiar chain reaction:
⚠ currency pressure
⚠ inflation spikes
⚠ fiscal intervention
The rational response is structural energy sovereignty.
India’s renewable capacity has one of the largest energy transitions ever attempted.
ConflictCarbonLoop
Energy markets are entering a reinforcing cycle:
Geopolitics → Fossil Volatility → Risk Premium → Renewable Investment → Energy Independence
Conflict unintentionally accelerates the transition that ultimately reduces fossil dependence.
HistoricalPatterns
Energy transitions rarely begin in calm periods.
They accelerate under system stress.
1970s oil shocks
→ nuclear expansion in France & Japan
2022 Russia–Ukraine war
→ record renewable build-out in Europe
2026 Gulf tensions
→ Asia re-pricing imported hydrocarbons.
KtalystInsights
Volatility converts climate policy into energy security policy.
KtalystInsights
KtalystKlues
DataComa
GreenLove$
5Ps 5Es
Originally published on LinkedIn on 2026-03-05 14:05:41: https://www.linkedin.com/feed/update/urn%3Ali%3Ashare%3A7435324663955849216
🧼 Greenwashing Gets Washed Out! 🌍
IndiaAndBeyond | June 2025
🔍 KtalystInsight: “Don’t rinse your image—clean your impact.
From buzzwords to busts, the world’s calling out fake green. Here’s your rinse cycle of reality:
🚨India
SEBI & CCPA are done with ESG fluff. Misleading ads? Tree-planting tall tales? Get ready for fines and fact-checks.
🇪🇺 EU
The much-hyped Green Claims Directive? Spun out. Politics > Planet, for now.
🇨🇦 Canada
New rules = no more eco-fairy tales. Truth in ads or face public & legal backlash.
🇨🇱 Chile
Writing greenwashing laws with teeth—and claws. Think fines, bans, and reversed burden of proof!
⚖️ France
TotalEnergies stands trial. A net-zero pledge doesn’t wash away fossil fuel facts.
🧾 Verdict?
🌱 Green is good. Greenwashed isn’t.
📊 Data > Drama. Truth > Trend.
Originally published on LinkedIn on 2025-06-26 01:17:45: https://www.linkedin.com/feed/update/urn%3Ali%3Ashare%3A7343809665182355459
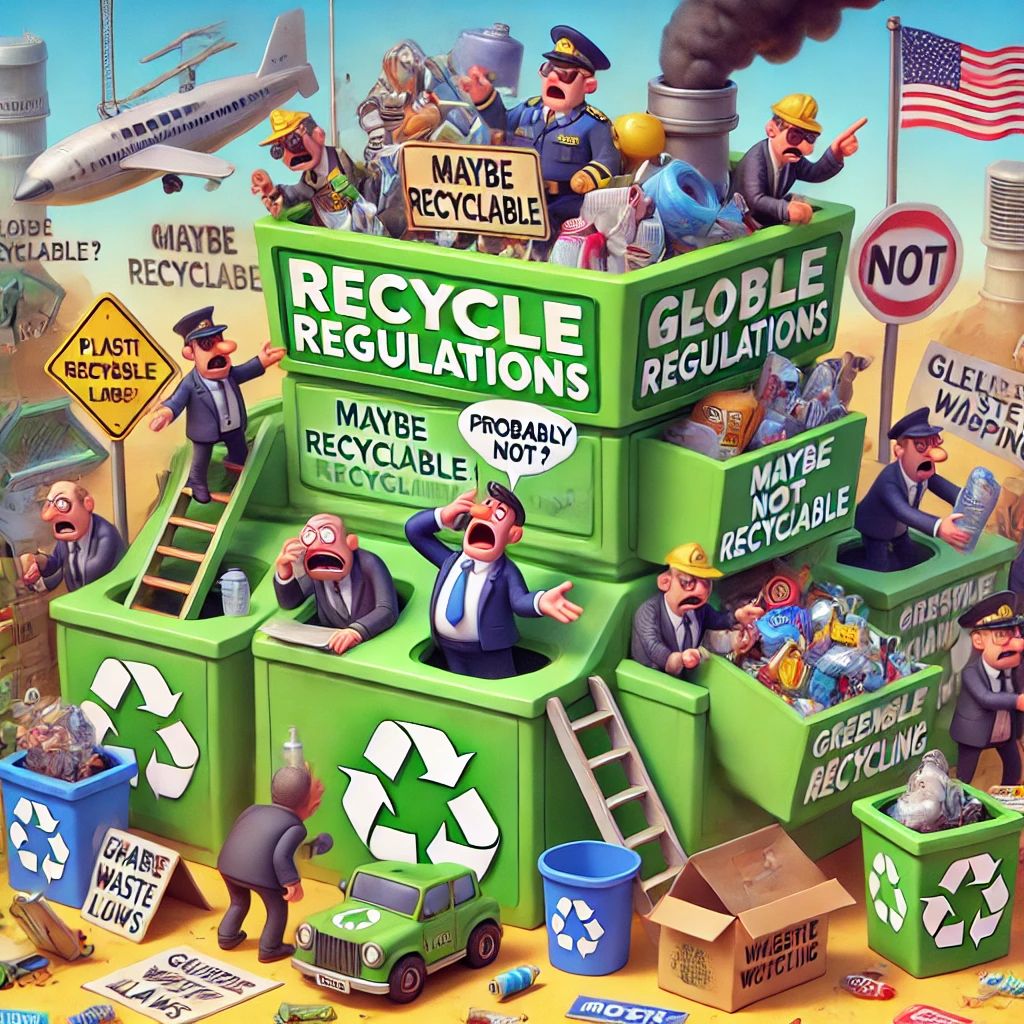
Recycle_Regulations: The New Gold Standard or a Global Mess?” ♻️🌍📜
Recycling isn’t just about throwing plastic into the right bin—it’s becoming a highly regulated industry with economic, environmental, and political implications. But are these recycle_regulations actually working, or are they just creating bureaucratic_chaos? Let’s break it down data-first.
📜 1. The Global Recycling Rulebook is Expanding
✅ Over 190 countries signed the Basel Convention, restricting plastic waste exports. (Source: UN, 2023)
✅ EU’s Circular Economy Package mandates 65% recycling targets by 2035. (Source: EU Commission, 2024)
✅ US States Are Taking the Lead: California’s SB 54 law requires 30% of plastic to be recyclable by 2028. (Source: CalRecycle, 2024)
🚨 The Problem? Many rules lack enforcement, and illegal waste dumping is still a #$10 billion global industry. (Source: Interpol, 2023)
⚖️ 2. Who’s Paying? The Battle Over EPR (Extended Producer Responsibility)
✅ Canada, EU & Japan require companies to fund recycling programs through EPR laws.
✅ India’s EPR Rules now hold businesses responsible for plastic recovery quotas. (Source: CPCB, 2024)
🚨 The Problem? Many companies shift costs to consumers, raising product prices.
🏆 Winner: Governments with strict accountability like Germany & South Korea.
❌ Loser: Developing nations drowning in imported plastic waste.
🛑 3. Greenwashing vs. Real Impact
✅ France bans ‘Recyclable’ labels unless companies prove 100% recyclability. (Source: French Gov, 2024)
✅ EU’s new Digital Product Passport tracks materials from production to disposal. (Source: EU Commission, 2024)
🚨 The Problem? 60% of ‘recyclable’ plastic isn’t actually recycled due to lack of infrastructure. (Source: Greenpeace, 2023)
🏆 Winner: Countries mandating transparency & product lifecycle tracking.
❌ Loser: Brands using misleading recycling claims.
🏗️ 4. The Future of Recycling Laws
📈 AI & Robotics to improve sorting efficiency & reduce contamination.
♻️ Chemical Recycling is gaining traction but faces cost & emissions concerns.
🚀 Global Agreements like the UN Plastics Treaty (2025) could reshape waste management worldwide.
🏆 Final Verdict: Recycling regulations are evolving, but enforcement is the real battle.
🏆 KeyTakeaway
Recycling isn’t just about being green—it’s about accountability. The future will belong to nations & businesses that get it right while others struggle with waste crises & regulatory chaos.
👉 Is your country leading or lagging in the recycling revolution?
RecycleRegulations CircularEconomy GreenLaws Sustainability PlasticCrisis NetZero
Originally published on LinkedIn on 2025-01-30 18:34:51: https://www.linkedin.com/feed/update/urn%3Ali%3AgroupPost%3A100646-7290799643045646336
Global Leaders in Ethanol Blending in Fuel: India’s Role and Achievements
NamasteIndia ranks among the top ethanol producers globally, alongside the US and Brazil. Tops Countries
1. US: The largest producer and consumer of ethanol, Production: 876K barrels Consumption 838K barrels per day.
2. Brazil: Produces 403K barrels per day and consumes 359K barrels per day.
3. China: Produces and consumes 43K barrels per day.
4. Canada: Produces 33K barrels per day; consumes 41K barrels per day.
5. France: Produces 17K barrels per day & consumes 13 thousand barrels per day.
6. Germany: Produces 13K barrels per day and consumes 27K barrels per day.
7. Colombia: 8.5K barrels/day (produces), 6.1K barrels/day (consumes).
8. Thailand: 8.1K barrels/day (produces), 9.1K barrels/day (consumes).
9. Guatemala: 8K barrels/day (produces).
10. Spain: 7.9K barrels/day (produces), 8K barrels/day (consumes).
11. Belgium: 6.8K barrels/day (produces), 1.8K barrels/day (consumes).
12. India: 5.3K barrels/day (produces & consumes).
13. Australia: 5.3K barrels/day (produces), 5.1K barrels/day (consumes).
14. UK: Produces 4.3 thousand barrels per day and consumes 17 thousand barrels per day.
India’s Ethanol Blending in Gasoline Industry
Key_Facts_&_Figures
Ethanol Blending Target: India aims to achieve 20% ethanol blending in gasoline by 2025, a goal accelerated from the original target of 2030.
Current Blending Level: As of May 2024, India has achieved a 15% ethanol blending rate.
Economic Impact: A successful ethanol blending program can save India approximately $4 billion (₹30K crore) annually by reducing oil imports.
Production Volume: India plans to produce around 10 billion liters (1,000 crore liters) of ethanol to meet the 20% blending target.
Role of Key Stakeholders
Government:
Policy Framework: The government has implemented policies like the National Policy on Biofuels.
Pricing and Incentives: The government administers ethanol prices and provides incentives to encourage production and blending.
Oil Marketing Companies (OMCs):
Procurement: OMCs issue annual tenders to procure ethanol from producers.
Blending and Distribution: OMCs blend ethanol with gasoline at designated depots and distribute the blended fuel to retail stations.
Sugar Industry:
Production: The sugar industry is a major producer of ethanol, utilizing by-products like molasses. Leading companies include Bajaj Hindusthan Sugar Ltd., Balrampur Chini Mills Ltd., Shree Renuka Sugars Ltd., and Dhampur Sugar Mills Ltd., contributing significantly to the total ethanol production.
Environmental impact: supports bioenergy production and waste utilization but also faces challenges like high water usage and pollution.
Originally published on LinkedIn on 2024-09-25 05:31:06: https://www.linkedin.com/feed/update/urn%3Ali%3AgroupPost%3A60128-7244579146016641026
NamasteIndia ranks 6th in the top 14 countries producing wind power as of 2023, along with their percentage increase in wind power capacity over the last 10 years:
1. China: 885 TWh (+190%)
2. United States: 425 TWh (+70%)
3. Germany: 137 TWh (+40%)
4. Brazil: 95 TWh (+210%)
5. United Kingdom: 82 TWh (+60%)
6. India: 71 TWh (+50%)
7. Spain: 60 TWh (+30%)
8. France: 45 TWh (+80%)
9. Canada: 35 TWh (+50%)
10. Italy: 30 TWh (+25%)
11. Sweden: 28 TWh (+90%)
12. Australia: 25 TWh (+120%)
13. Turkey: 22 TWh (+100%)
14. Netherlands: 20 TWh (+150%)
Future_Potential:
China: Exceptional wind resources due to its large land mass and long coastline.
United_States: Vast areas with high wind speeds, especially in the Midwest.
Germany: Consistent wind flow in the North Sea region.
Brazil: Strong wind flow in coastal regions.
United Kingdom: Excellent wind conditions, particularly offshore.
India: Significant potential in coastal areas like Tamil Nadu and Gujarat, and hilly regions such as Himachal Pradesh.
Countries with Untapped Wind_Power_Potential:
Russia: Despite significant wind potential, it generated less than 1% of its electricity from wind in 2023.
Japan: Has strong wind resources but has not fully developed its wind power infrastructure.
South_Korea: Similar to Japan, it has good wind potential but limited development.
These countries have the right wind conditions to further increase their wind power capacity in the future.
Originally published on LinkedIn on 2024-09-19 10:31:36: https://www.linkedin.com/feed/update/urn%3Ali%3Ashare%3A7242480441604161536
NamasteIndia’s Intangible Investment Surge: Paving the Way to a $400 Billion Future by 2030.
Rapid Growth: India has recorded the fastest growth in intangible investments from 2011 to 2020, outpacing major economies like the US, France, Germany, and the UK.
Key Drivers: This growth is fueled by strengths in software and data, new financial products, and increased investment in domestic brands.
Global Position: In 2020, India ranked 14th in absolute levels of intangible investments among 26 advanced economies.
Economic Impact: The significant increase in intangible investments, reaching approximately $200 billion USD in 2020, underscores India’s expanding role in global innovation and intellectual property.
Projections till 2030
Double in Value: Intangible investments could potentially double, reaching around $400 billion USD.
Enhanced Innovation: Continued emphasis on R&D, software development, and brand building will drive further innovation.
Global Leadership: India is poised to strengthen its position as a global leader in intellectual property and innovation.
Source / shared link: https://m.economictimes.com/news/economy/indicators/india-outpaces-major-economies-in-growth-of-intangible-investments/articleshow/112421471.cms
Originally published on LinkedIn on 2024-08-11 02:46:29: https://www.linkedin.com/feed/update/urn%3Ali%3Ashare%3A7228230264081027072

