GreenGreed & CleanGrids 🍃
Dr. Anju Sharma | MrsSustainability | KtalystInsights
I was reading an engaging Bloomberg piece & hit like a plot twist: coal_based grid consumption in China & NamasteIndia is on a downward pivot. Not because coal suddenly became unpopular but because the grid is getting new muscles: more renewables, better dispatch, and harder economics.
Plot twist: “Green” has two meanings.
🟢 PlanetGreen = clean electrons
💵 DollarGreen = who pays + who profits
And the grid? TheGrid only respects24/7 electricity.
1) CoalGoal = “No Blackouts” Goal 🪨⚡
Coal isn’t the dream. Coal is the backup friend when solarghosts you at 7pm.
✓ Night-time demand + evening ramp
✓ Heatwaves + peak load panic
✓ Factory spikes + weekday surges
✓ Gas prices acting spicy
✗ Coal doesn’t “win” because it’s loved
✗ Coal wins when storage + transmission are late
2) Is fossil fuel getting retired?
Not fully. But the old privilege is.
✓ “Operate” now needs a plan: emissions + affordability + security
✓ Financing is harder for high-emission, high-cost assets
✗ The era of “Burn first, explain later” is fading
✗ Fossil is no longer default — it’s case-by-case
3) The uncomfortable globalmath 🌍
Coal is still mostly an Asia story.
✓ China + India ≈ ~70% of global coal use
✓ So global coal decline = Asia’s grid upgrade story
✗ Speeches don’t bend coal curves
✗ Only systems do: transmission, storage, flexible markets
4) YR2025 → YR2030: AIEeeks
Demand rises anyway (AC + EVs + industry). AI adds the “always-on” layer.
✓ Data centres = electricity gyms (always training, always hungry)
✓ Forecast: data-centre power use could ~double by 2030 (~945 TWh)
✗ This isn’t just “more electricity
✗ It’s more 24/7 electricity (firm power becomes valuable)
5) The real battle: Clean vs Chaos ⚡
Not green vs coal. It’s grid-ready vs grid-wishful.
✓ Renewables (cheap energy)
✓ Storage (night + peaks)
✓ Smart grids (less waste)
✓ Transmission (move power where needed)
✓ Some firm power (until storage scales)
✗ A “clean” grid that can’t survive 7pm
✗ A transition built on vibes, not infrastructure
If your ‘green’ can’t survive 7pm, it’s not a transition, it’s a mood.” Dr. Anju Sharma
Originally published on LinkedIn on 2026-01-29 11:05:47: https://www.linkedin.com/feed/update/urn%3Ali%3AugcPost%3A7422595814646251520
Banks_Blooming_with_Green_Fee(But Not Everywhere)
Dr. Anju Sharma | KtalystInsights™ | KtalystKlues™
Bloomberg confirms a structural shift in 2025, GreenFees overtook Fossil-linked fees $3.7B vs $2.9B.
What Matters
TotalTees fell vs YR2024, as US_banks_stepped_back from climate alliances post-Trump’s return?
KtalystKlues:
1) EU Banks Power the Fee Engine
🟢 Largest green fee pool globally
🟢 Sovereign + corporate issuance at scale
🟢 Regulation = predictable deal flow
🔴 Minimal reliance on “voluntary ESG
Who captures fees?
BNP Paribas | Crédit Agricole | Deutsche Bank |
Why they win:
✔ Early ESG structuring
✔ In-house carbon & covenant expertise
KtalystKlues™: Europe scaled green fees. They didn’t lose them.
2) US Scale Wins, Regionals Miss Out
🟢 Structuring-heavy SLBs & transition bonds
🟢 Deep investor pools = premium pricing
🟢 Global underwriting reach
🔴 Deal flow volatility post climate exits
Fee winners:
JPMorgan Chase | Bank of America | Morgan Stanley
What holds regionals back:
✗ Vanilla lending
✗ Thin ESG structuring skills
KtalystKlues™: In the US, capability beats proximity.
3) China Volume Over Pricing Power
🟢 Policy-mandated issuance
🟢 State balance sheets guarantee scale
🟢 Multi-currency green bonds
🔴 Limited fee innovation
Dominators:
ICBC | Bank of China | CITIC Securities
KtalystKlues™: China earns green fees by volume certainty, not differentiation.
4) Japan — Predictable, Not Explosive
🟢 Samurai green bonds
🟢 Infra-linked transition finance
🟢 Conservative risk culture
Anchors:
Mizuho | MUFG
₹KtalystKlues™: Japan runs green finance like pensions—slow, steady, reliable.
5) NamasteIndia — Local Risk, Global Fee Capture
🟢 Fastest-growing green capex market
🟢 Sovereign green bonds crossed $5.7B (2024)
🔴 Domestic underwriting depth still thin
🔴 Fees migrate offshore
Who earns the fees:
HSBC | Citi | JPMorgan
Who carries the risk:
SBI | ICICI Bank | Axis Bank
India’s Green Fee Unlock 🔓
🟢 Deeper SEBI green taxonomy
🟢 PSU balance-sheet reform
🟢 Stronger domestic investor base
🟢 Rupee green-bond liquidity
KtalystKlues™: India builds green assets but exports green fees. Policy × capability = India’s green-fee moment.
What’s DecliningFastGlobally
🔴 Fossil project-finance underwriting
🔴 Plain-vanilla corporate bonds
🔴 Banks without ESG structuring depth
KtalystKlues™: Green didn’t just grow. It replaced old fee pools.
The RealDifferentiator (NoGreenwashing)
🟢 Carbon accounting embedded in deals
🟢 Sustainability-linked covenants
🟢 Cross-currency green structuring
🔴 Legacy DCM skillsets
KtalystKlues™: Green finance rewards risk pricing skill, not slogans.
Green banking fees aren’t rising everywhere. They’re migrating to skill clusters. –Dr. Anju Sharma
Originally published on LinkedIn on 2026-01-04 14:57:08: https://www.linkedin.com/feed/update/urn%3Ali%3Ashare%3A7413594337663688704
Hello2026.Demand_stability_no_longer_guarantees_profit_stability. Dr. Anju Sharma
KtalystInsights™ | KtalystKlues™ | MrsSustainability™
Same demand?.
Same products?
Different profits: because decisions changed.
Where strategy starts failing?
ProfitVolatility didn’t emerge overnight. It was designed upstream by political & industrial leadership decisions that refunneled country-level cost math.
FinanceLens:
Leadership decisions → Country cost structure → Sector margins
1) EU CarbonCost exposure
✓ CBAM initiated proxy: €80–100/tCO₂
✓ Landed-cost uplift: +2–5%
✓ EBITDA dispersion (same sector): 300–500 bps
Sectors
✓ Steel / Aluminium / Cement: survival = top-quartile efficiency
✓ Chemicals: selective pass-through, margin split
✓ Automotive: supplier repricing + Scope-3 pressure
2) US Earnings timing exposure
✓ IRA incentives swing IRRs 10–30%
✓ Domestic-content rules add 5–15% cost
✓ Forecast volatility tied to policy cycles
Sectors
✓ EV / Batteries: winners decided by incentive timing
✓ Renewables: policy-window economics
✓ Manufacturing: reshoring lifts capex, not always margins
3) China Pricing pressure exposure
✓ Export undercutting: 5–20%
✓ Capacity defended via pricing, not margins
✓ Volumes stable, margins externalised
Sectors
✓ EVs: global margin reset underway
✓ Steel: export-led compression
✓ Chemicals: oversupply → global dilution
Notice how none of these risks originate from demand.
4) NamasteIndia Alignment exposure
✓ Safeguard duties selective by sector
✓ Export controls swing margins ±10–25%
✓ Incentives tied to localisation & scale
Sectors
✓ Steel / Electronics: margin insulation
✓ Chemicals: winners where import substitution aligns
✓ Agri / Energy: episodic volatility
5) MiddleEast Transition timing exposure
✓ Fossil fuels still deliver >70% cash flows
✓ Transition CAPEX front-loaded
✓ Paybacks extended 5–8 years
Sectors
✓ Oil & Gas: cash-rich, valuation-sensitive
✓ Hydrogen / SAF / Ammonia: capex-heavy, margin lag
✓ Petrochemicals: feedstock edge vs demand risk
6) ASEAN Stability premium
✓ Manufacturing growth: high single-digit CAGR
✓ Lower tariff churn vs US/EU
✓ EBITDA volatility materially lower
Sectors
✓ Electronics / Components: China+1 beneficiaries
✓ Consumer goods: margin stability
✓ Light manufacturing: predictable cost curves
What this changes in YR2026
✓ Profit volatility is geographic + sectoral, not cyclical
✓ Cost risk is increasingly externalised at borders
✓ Business sustainability = margin durability, not intent
✓ Strategy fails where country–sector math is ignored
KtalystInsights™:
✓Markets didn’t suddenly become uncertain.They became conditional country by country.
✓The P&L is no longer reacting to markets.
It is reacting to choices made upstream — political and industrial.
Hello2026 KtalystKlues LeadershipDecisions
DataComa
Originally published on LinkedIn on 2026-01-04 08:15:05: https://www.linkedin.com/feed/update/urn%3Ali%3Ashare%3A7413493157688168448
🚨 Moody’s Shakes_Up_Credit_Ratings: The Green_Penalty & Reward_Effect!♻
With #$1.6T+ in ESG-linked financing, Moody’s is redefining creditworthiness, rewarding sustainability leaders & penalizing ESG laggards. 📉🚀 Companies failing on climate, social, & governance metrics are seeing their ratings cut—raising borrowing costs & investor risks.
📊 Companies Hit by Moody’s ESG_Based_Credit_Rating Adjustments
🟥 Nissan Motors – Downgraded 🚨
📌 Moody’s cut Nissan to junk due to weak sustainability integration & financial instability. (Source)
🟥 PG&E – Downgraded 🚨
📌 #$30B in wildfire liabilities led Moody’s to downgrade PG&E, linking climate risk to creditworthiness.
🟩 Royal Philips – Upgraded 🚀
📌 Green loan secured with ESG-linked interest rates, rewarding sustainability progress.
🟥 Thames Water – Downgraded 🚨
📌 Environmental violations & debt risks slashed its credit rating, as S&P flagged financial instability.
🟩 Casino Guichard-Perrachon – Upgraded 🚀
📌 Secured sustainability-linked loans, reducing interest rates based on ESG performance.
🟥 Enbridge – Downgraded 🚨
📌 Despite green loans, Moody’s questioned its carbon-heavy projects, impacting its rating.
🟩 Unibail-Rodamco-Westfield – Upgraded 🚀
📌 Green finance unlocked better credit conditions via ESG-tied loans.
🟥 Avangrid Gas Subsidiaries – Downgraded 🚨
📌 Regulatory ESG concerns lowered its credit ratings, citing fossil fuel dependency.
🟩 Drax Group – Under Review 🔍
📌 Sustainability-linked loans triggered scrutiny over carbon intensity goals.
🟥 Southern Water – Downgraded 🚨
📌 Environmental fines & governance risks led Moody’s to cut its credit rating.
🔥 The Takeaway: Moody’s Is Now Pricing in Sustainability Risks
🟢 17% of Moody’s rated firms see ESG risks impact their credit scores.
🟢 Companies with poor sustainability scores pay up to 15% higher borrowing costs.
🟢 Sustainability-linked finance = Lower interest rates & stronger credit ratings.
📢 Is this the wake-up call for businesses ignoring ESG? Let’s discuss below! 👇

Originally published on LinkedIn on 2025-02-27 12:45:56: https://www.linkedin.com/feed/update/urn%3Ali%3AgroupPost%3A82951-7300858693879799809
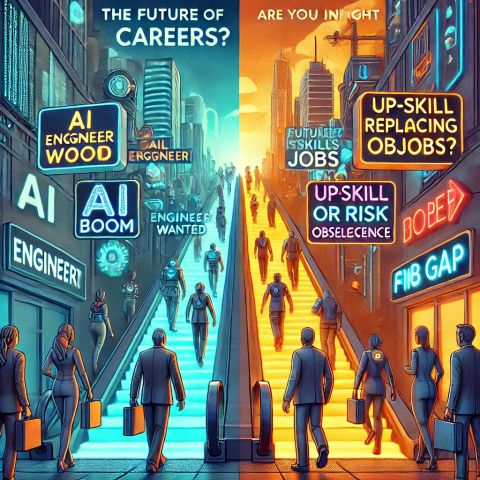
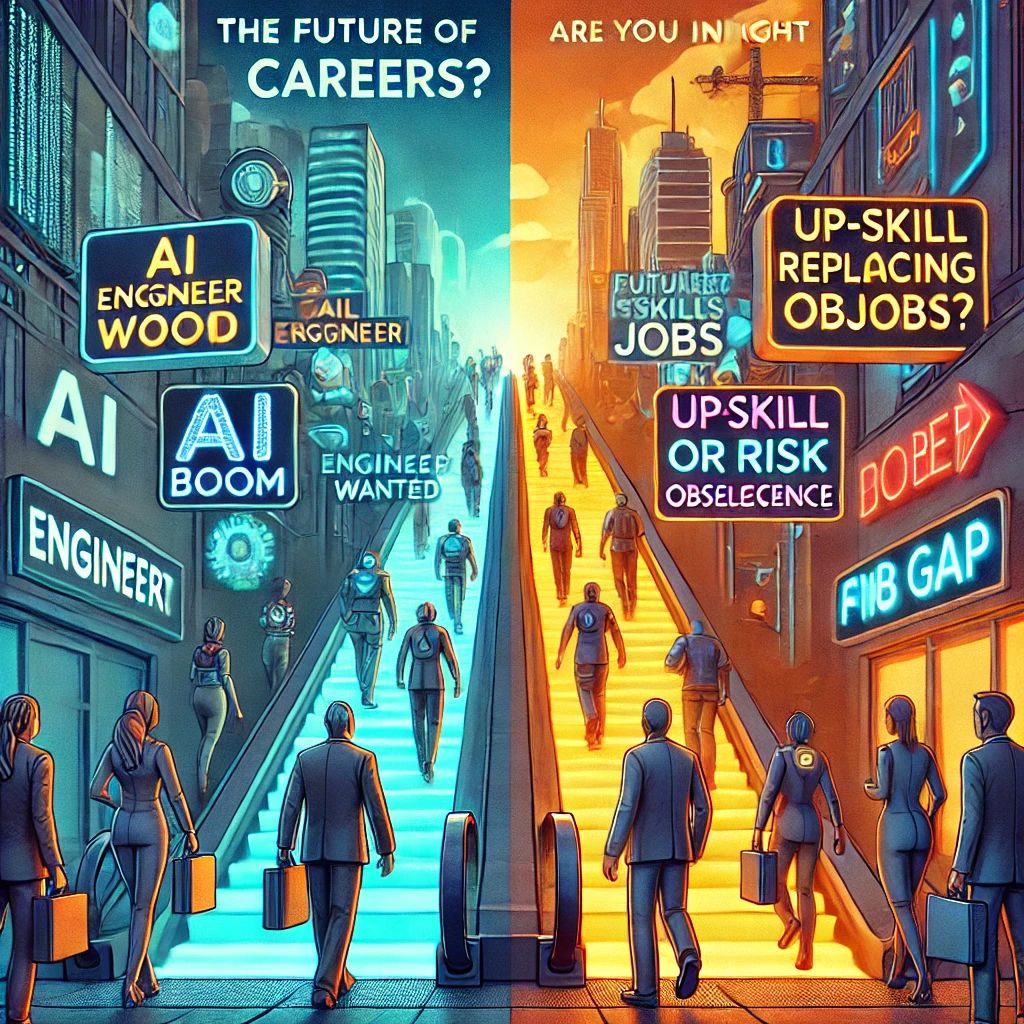
🚀 The Future of Careers: Are You Ready? 💼📊
As AI, automation, and digitalization reshape jobs, the key to survival is choosing the right industry and upskilling. But with employment rates fluctuating, is the job market truly evolving?
📉 Job Market Shifts (Last 5 Years)
🚨 Global employment rate at 56.3% in 2024, still below pre-pandemic levels. (Statista, 2024)
🚨 64.9M young people unemployed worldwide. (ILO, 2024)
🚨 Retail jobs shrinking by 364,800 in the U.S. by 2033 as e-commerce rises. (Statista, 2024)
🚨 Manufacturing jobs rebounding in tech-driven regions, but traditional hubs still struggle. (EIG, 2024)
📌 Reality Check: The real crisis isn’t job loss—it’s the growing skill gap.
📊 Fastest-Growing Career Paths
✅ Tech & AI 💻 – AI engineers, cybersecurity, data scientists. (38% growth by 2030, WEF 2024)
✅ Healthcare & Biotech 🏥 – Telemedicine, bioinformatics. (14% job growth in a decade, BLS 2024)
✅ Sustainability & Green Economy 🌍 – ESG auditors, renewable energy. (Green jobs to outpace fossil fuels 4:1, IEA 2024)
✅ Finance & Fintech 💰 – Blockchain, digital banking. (18% YoY hiring increase, PwC 2024)
✅ Manufacturing & Supply Chain 🏭 – Robotics, AI logistics. (80% of manufacturers lack skilled workers, Deloitte 2024)
🚨 Reality Check: Automation isn’t killing jobs—it’s transforming them.
📉 Careers at Risk
❌ Fossil Fuels – Declining as renewables grow.
❌ Print Media – AI replacing journalism.
❌ Basic Customer Service – AI chatbots taking over.
❌ Traditional Automotive – EVs need fewer parts, reducing jobs.
🚨 Reality Check: Industries aren’t dying—skills are evolving.
🧠 The Skills You Need Now
📌 AI & Data Proficiency – Even non-tech jobs need AI literacy.
📌 Cybersecurity & Digital Skills – The digital economy depends on security.
📌 Sustainability & ESG Knowledge – Businesses need climate-conscious leaders.
📌 Creativity & Adaptability – AI can’t replace problem-solving.
🚨 Reality Check: Lifelong learning isn’t optional—it’s survival.
🏆 KeyTakeaway
Your career could be future-proof with the right skills, should be aligned with growth industries, but would be at risk without adaptation.
👉 Are you ready for the future of work?
FutureOfWork CareerGrowth Upskilling AI GreenJobs Automation
Originally published on LinkedIn on 2025-02-04 13:44:47: https://www.linkedin.com/feed/update/urn%3Ali%3AgroupPost%3A9270968-7292538584681635841
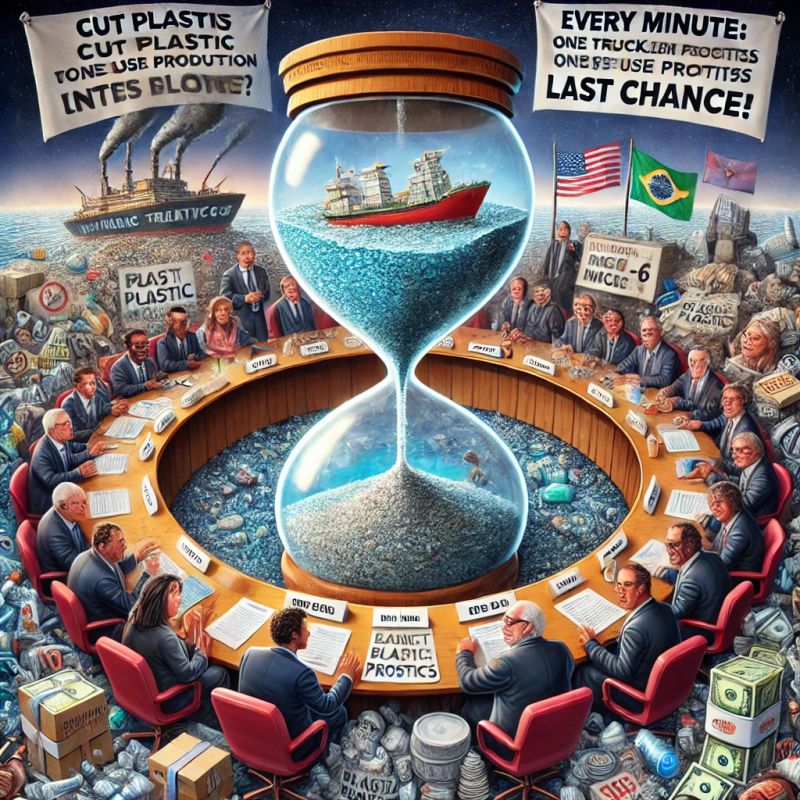
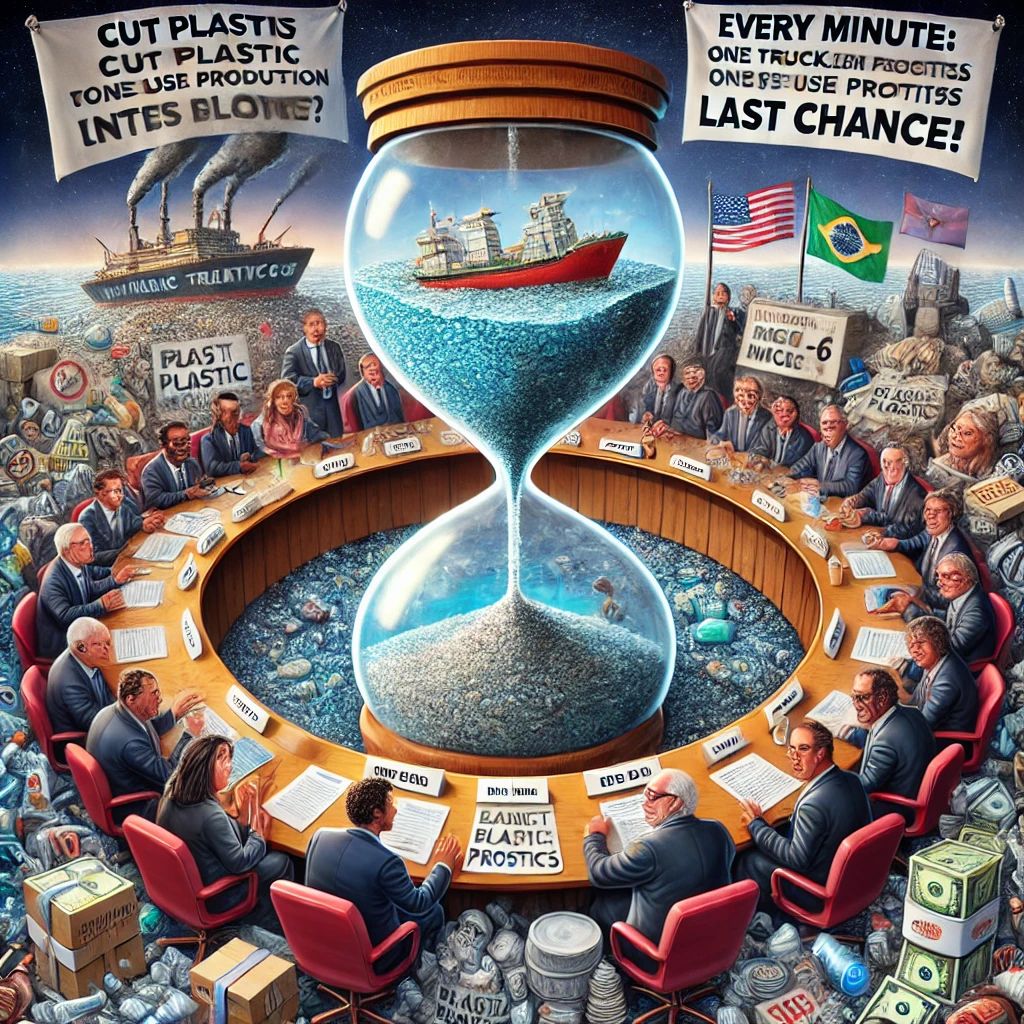
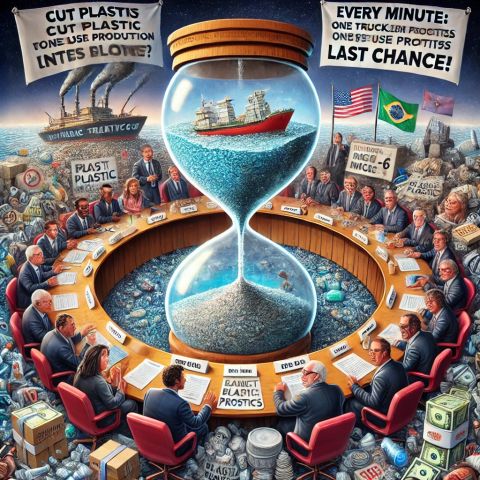
🚨 “Plastic Treaty Deadlock: Is INC-5 Fighting Pollution or Protecting Profits?” ♻️🌍💰
The Intergovernmental Negotiating Committee (INC-5) just wrapped up in Busan, South Korea, aiming to finalize a legally binding treaty on plastic pollution. Instead, the world got another delay. Why? A battle between cutting plastic production and protecting corporate interests.
🔴 1. The Big Divide: Who Wants Action vs. Who Wants Delay?
✅ 85 countries, including the EU and small island nations, pushed for binding plastic production cuts. (Source: UNEP, 2024)
❌ Saudi Arabia, Iran, and Russia led opposition, arguing waste management—not production—is the issue. (Source: The Guardian, 2024)
✅ Plastic waste is projected to triple by 2060 without drastic cuts. (OECD, 2024)
❌ Fossil fuel lobbyists outnumbered environmental groups 3:1 at INC-5, weakening proposals. (Source: WSJ, 2024)
🚨 Reality Check: Plastic production is expected to double by 2040, worsening the crisis. (Source: OECD, 2024)
🟡 2. The Stalemate: Key Proposals vs. Pushback
✅ Caps on virgin plastic production – would target the 450M tons of plastic produced annually. (Source: UNEP, 2024)
✅ Phase-out of toxic chemicals – over 16,000 chemicals are used in plastic, many unregulated. (IPEN, 2024)
✅ Stronger Extended Producer Responsibility (EPR) – shifts waste costs from consumers to corporations.
❌ Plastic production is still expected to grow by 80% by 2050 under current policies. (IEA, 2024)
❌ Half of all plastic ever made has been produced since 2000. (National Geographic, 2024)
🚨 Reality Check: Without cuts, plastic pollution will double in the ocean by 2040. (Source: Pew Charitable Trusts, 2024)
⚠️ 3. The Hard Truth: INC-5 is Running Out of Time
❌ Every minute, the equivalent of a garbage truck of plastic enters the ocean. (WWF, 2024)
❌ Only 9% of all plastic ever made has been recycled. (UNEP, 2024)
❌ Microplastics have been found in 80% of human blood samples tested. (Science Advances, 2024)
🚨 Reality Check: If INC-6 doesn’t enforce production cuts in 2025, this treaty risks becoming another empty climate agreement.
🏆 KeyTakeaway
The INC-5 negotiations ended in deadlock, as plastic-producing nations prioritize profits over pollution cuts. Without stronger global action in INC-6, this treaty could turn into just another greenwashed agreement.
👉 Will the world get a real plastic treaty—or just more delays?
PlasticCrisis NetZero Greenwashing ClimateAction INC5
Originally published on LinkedIn on 2025-02-03 08:51:04: https://www.linkedin.com/feed/update/urn%3Ali%3AgroupPost%3A9270968-7292102277627105281
NamasteGreenIndia’s Ethanol Revolution: Achieving 20% Blending with a Sustainable Edge
India is on the brink of achieving a 20% ethanol blending target, a transformative step towards energy independence, environmental sustainability, and agricultural empowerment. Here’s how this revolution is shaping up:
📈 The Progress So Far
🟢 2014: Ethanol blending in petrol was just 1.53%.
🟢 2024: Achieved 15%, with 4.62 million metric tonnes (MMT) of ethanol produced.
🟢 2025 Target: Projected to produce 10.2 MMT annually to meet blending and industrial needs.
🌍 Economic & Environmental Wins
💰 USD 4 Billion Saved: Annual savings on crude oil imports.
🌎 10 MMT CO₂ Reduced: Emissions cut significantly with 20% ethanol blending.
👷 500,000 Jobs Created: Boosting rural employment through distilleries and supply chains.
🚢 USD 300 Million Export Potential: Surplus ethanol positioned for international markets.
🚗 Automotive Industry’s Ethanol Push
🔧 Flex-Fuel Vehicles: Tata Motors, Mahindra, Maruti Suzuki, and Hyundai to launch 100% bio-ethanol vehicles within six months.
🛢️ Fossil Fuel Demand Cut: Flex-fuel vehicles to reduce reliance on fossil fuels by 5.5 MMT annually.
🏭 Toyota’s Commitment: Investing ₹20,000 crore (USD 2.4 billion) in ethanol-compatible vehicle production.
🌾 Agricultural Boost
🌱 8-9 MMT of Sugar: Diverted annually for ethanol production, stabilizing prices and supporting farmers.
🌾 1.5 MMT of Surplus Grains: Utilized for ethanol, ensuring sustainable revenue for agriculture.
⚡ Challenges & Opportunities
📊 Feedstock Demand: India needs an additional 2 MMT of sugarcane and 1.5 MMT of surplus grains for sustainable production.
🏗️ Infrastructure Gaps: Only 30% of fuel pumps are ready for E20 blending.
🌍 Global Leadership: Scaling production and refining distribution could position India as a leader in ethanol exports.
💡 Why This Matters
India’s ethanol revolution is more than a blending target—it’s about energy self-reliance, cutting carbon footprints, and empowering rural economies. This initiative showcases India as a global benchmark for sustainable energy transitions.
💬 Let’s discuss how India’sEthanolJourney is driving SustainableEnergy, AutomotiveInnovation, and RuralEmpowerment! 🚀
Originally published on LinkedIn on 2025-01-16 09:51:29: https://www.linkedin.com/feed/update/urn%3Ali%3AgroupPost%3A12538632-7285594503120347137
YR2024_India’s Bioenergy Capacity Hits New Milestone
India has reached a significant milestone in its clean energy efforts, with bioenergy playing a key role in the renewable energy mix. As of 13th November_2024, bioenergy contributes significantly to India’s renewable portfolio, supporting the country’s transition toward net-zero emissions by 2070.
With advancements in biogas, bioethanol, bio_CNG, and biomass power, India is accelerating its clean energy goals:
Bioenergy (~6%) now forms a critical part of the 46.3% renewable energy share in the total installed power capacity.
The sector supports decarbonization in transportation, industry, and aviation through initiatives like bioethanol blending and Sustainable Aviation Fuel (SAF).
India’s bioenergy growth reflects its focus on reducing fossil fuel dependency while strengthening its $20 billion bioeconomy, creating a sustainable and greener energy future.
India’s Bioenergy Partnerships in 2024
✅ TruAlt Bioenergy & Sumitomo Corporation
Focus: Biogas, Bioethanol, SAF
Target: Cutting fossil fuel dependency by 50%.
✅ ISMA, TERI & Praj Industries
Focus: SAF, Green Hydrogen
Target: 12 billion liters SAF annually by 2030.
✅ India_Brazil SAF Collaboration
Focus: SAF Supply Chain Optimization
✅ BPCL ($170M Investment)
Focus: SAF Production
Target: 5% SAF blending by 2030.
✅ IOC & LanzaJet
Focus: Waste-to-Ethanol SAF
Output: 80,000 metric tons annually.
✅ GPS Renewables & SAF One
Focus: Aviation Emission Reduction (8% GHG emissions).
✅ Adani Total Gas & Greenko Group
Focus: Biogas, Green Hydrogen
Impact: 10% reduction in industrial emissions by 2035.
✅ Reliance & Air Products
Focus: Bioethanol, SAF
Strengthening the $20 billion bioeconomy.
✅ Tata Power & Shell India
Focus: Bio-CNG, Biogas
Target: 5M metric tons annually by 2030.
✅ NTPC & Honeywell International
Focus: Green Methanol, SAF
Emissions Reduction: 20% by 2035.
✅ Vedanta & EcoEnergy Europe
Focus: Waste-to-Bioethanol
Target: 20% ethanol blending by 2025.
✅ L&T & Siemens Energy
Focus: Biohydrogen
Target: 1M metric tons annually by 2030.
Why This Matters
India’s bioenergy partnerships are driving innovation, emissions reduction, and economic growth.
📊 Key Stats:
50% fossil fuel dependency reduction by 2030.
12B liters SAF production annually by 2030.
20% ethanol blending by 2025.
5M metric tons of biogas production annually.
1M metric tons of biohydrogen by 2030.
India is laying the foundation for a sustainable and net-zero tomorrow, proving that collaboration is key to progress.
Source / shared link: https://pib.gov.in/PressReleaseIframePage.aspx?PRID=2073038
Originally published on LinkedIn on 2024-12-17 15:02:29: https://www.linkedin.com/feed/update/urn%3Ali%3AgroupPost%3A3880479-7274801133875822593

