TheChemical_Industry generated ~USD57billion in net profits and invested ~USD73billion in CAPEX in YR2024, yet TSR remains structurally weak. WHY?
Dr. Anju Sharma
KtalystInsights™ MrsSustainability
KtalystKlues
This is not a DemandParadox; it is a ValueCapture problem.
1) The industry is still profitable
✓ Global Top-50 chemical companies reported #~USD57billion net profit in 2024
✓ Average sector EBITDA margins ~12–15% for large integrated players
✓ A majority of listed chemical companies remained cash-positive despite margin pressure
KtalystInsights:
Profitability exists; this is not a demand-led downturn.
2) Capital investment has not stopped
✓ Global chemical CAPEX in 2024: ~USD73billion (Top-50 companies)
✓ R&D spend grew ~2–4% YoY in 2024 despite earnings pressure
KtalystInsights:
Industries facing structural demand decline do not sustain this level of investment.
3) Volumes are growing faster than pricing
✓ Global chemical market size grew from #~USD6.18trillion (2024) to #~USD6.32trillion (2025E)
✓ Packaging, electronics, mobility & construction chemicals showed #~1.5–3% volume growth
✓ Real pricing power across bulk and semi-specialty chains remained flat to negative
KtalystInsights:
Demand growth exists, but value per unit has diluted.
4) TSR is weak because capital intensity has risen
✓ Chemical sector 5-year TSR ~2–3% p.a. vs #~8–9% for MSCI World
✓ Average CAPEX-to-sales ratio increased ~150–250 bps vs pre-2015 levels
✓ Energy transition and ESG CAPEX raised fixed costs without near-term pricing upside
KtalystInsights:
Returns compress when each dollar of profit requires more capital.
5) Overcapacity is real—but uneven
✓ China accounted for #~40%+ of global new petrochemical capacity additions (2019–2024)
✓ Utilisation in multiple commodity chains remains #~70–80%, below mid-cycle norms
✓ Specialty chemicals show #~40–50% lower EBITDA volatility vs commodity chemicals
KtalystInsights:
McKinsey’s conclusion fits commodity and aging specialty chains, not the entire sector.
6) Segment data shows divergence, not uniform decline
✓ Regulation-linked chemicals often sustain ROIC in the high-teens to low-20% range
✓ Application-embedded specialties outperform sector TSR by ~300–500 bps
✓ Commodity chemicals trend at or near cost of capital
KtalystInsights:
The issue is business-model selectivity, not sector weakness.
7) What McKinsey measures vs what boards must decide
✓ McKinsey evaluates relative investor returns (TSR)
✓ Boards must manage absolute cash generation and capital efficiency
✓ Demographics support demand; strategy decides economic rent
KtalystInsights:
Chemicals are essential—but not all are equally rewarded.
> This is not a low-demand cycle.
It is a high-capital, low-pricing-power environment.
Dr. Anju Sharma
KtalystInsights™ MrsSustainability Chemicals Strategy ValueCapture TSR BoardroomLens DataComa
Originally published on LinkedIn on 2025-12-28 10:35:57: https://www.linkedin.com/feed/update/urn%3Ali%3Ashare%3A7410991894211543040
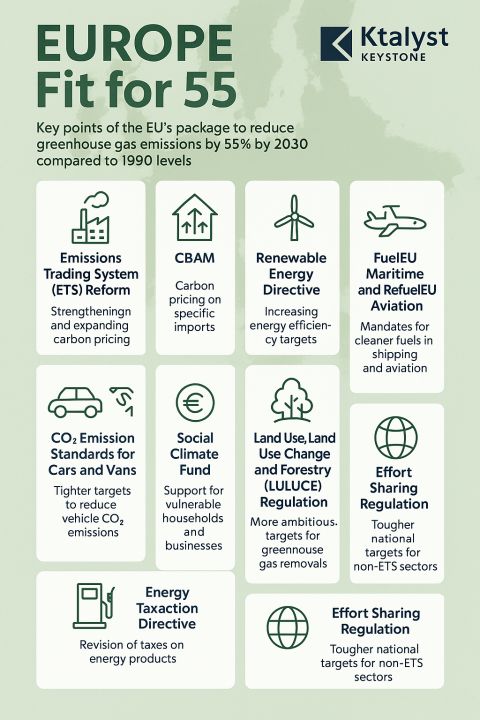
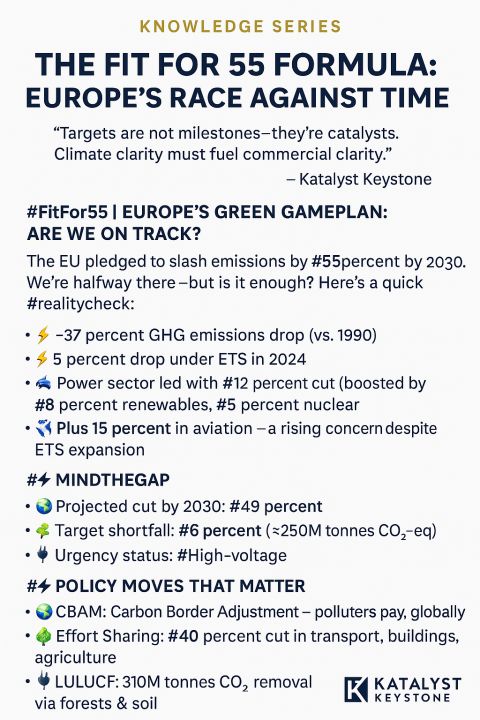
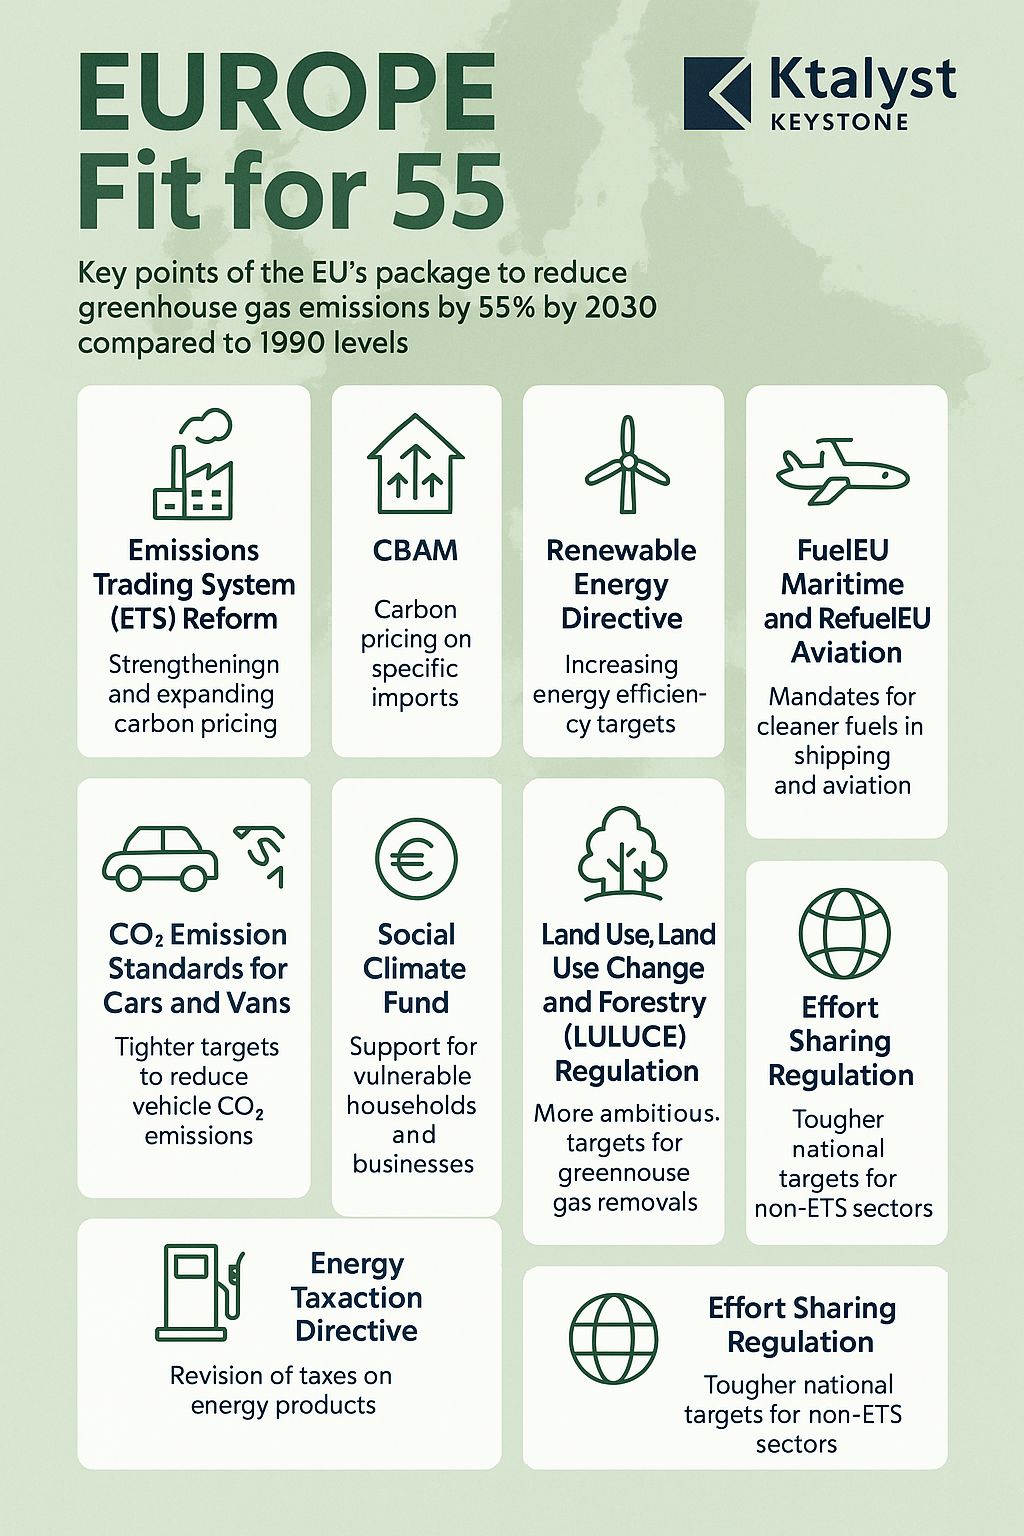
KatalystKnowledge | The FitFor55 Formula: Europe’s Race Against Time
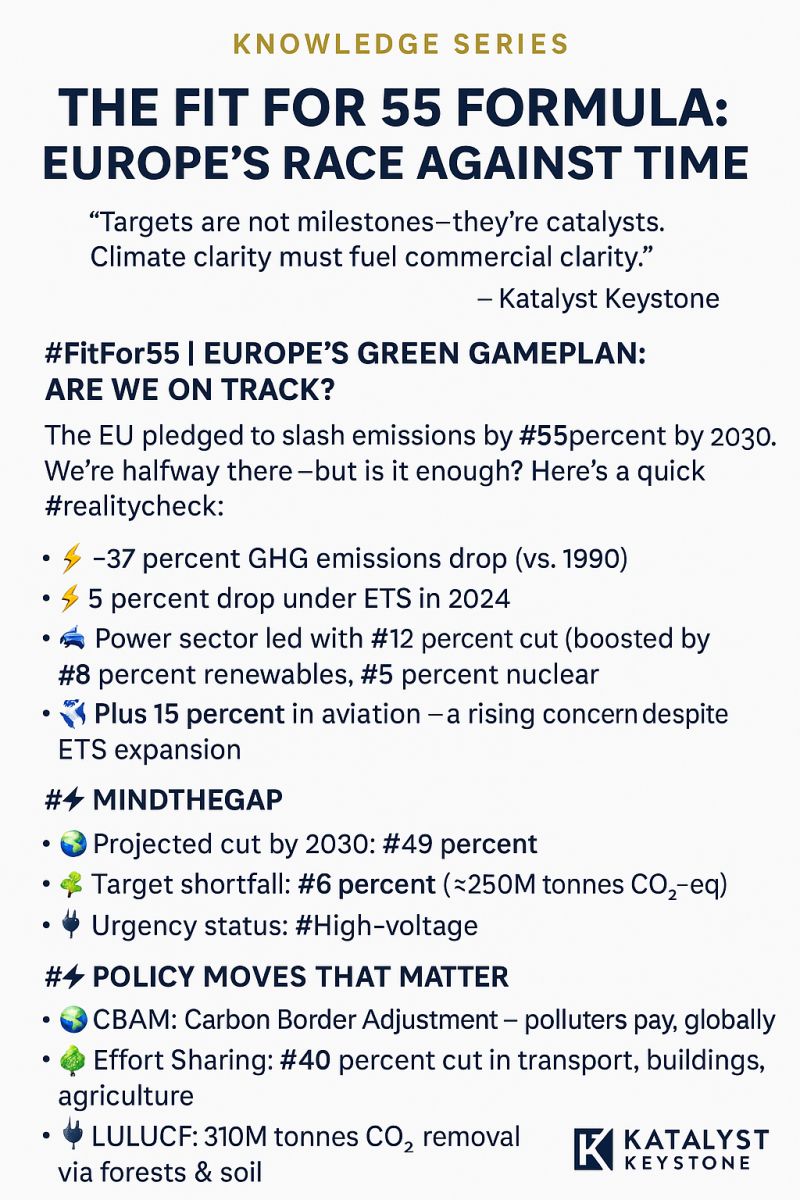
Targets are not milestones—they’re catalysts. Climate clarity must fuel commercial clarity.
KtalystKeystone
FitFor55 | Europe’s Green Gameplan: Are We On Track?
The EU pledged to slash emissions by 55percent by 2030. We’re halfway there—but is it enough? Here’s a quick realitycheck:
#️Progress So Far
⚡ Minus 37 percent GHG emissions drop (vs. 1990)
♻️ 5 percent drop under ETS in 2024
⚡ Power sector led with 12 percent cut (boosted by 8 percent renewables, 5 percent nuclear)
✈️ Plus 15 percent in aviation—a rising concern despite ETS expansion
🏭 Industry? Flat. Cement down, fertilizers up
MindTheGap
Projected cut by 2030: 49 percent
Target shortfall: 6 percent (≈250M tonnes CO₂-eq)
Urgency status: High-voltage
Policy Moves That Matter
🌍 CBAM: Carbon Border Adjustment – polluters pay, globally
🛣️ Effort Sharing: 40 percent cut in transport, buildings, agriculture
🌳 LULUCF: 310M tonnes CO₂ removal via forests & soil
🔌 Renewables Goal: 42.5 percent by 2030 (plus 2.5 percent aspirational boost to 45 percent)
Takeaway
The EU is moving—but not fast enough.
To reach the finish line:
Scale green hydrogen & biofuels
Electrify transport
Cut industrial emissions deeper
LeadershipLens
Green goals aren’t just numbers.
They’re strategy. They’re urgency. They’re our business future.
KtalystKeystone Insight:
We help you align business with policy—because climate clarity = profit clarity.
Originally published on LinkedIn on 2025-04-09 05:45:15: https://www.linkedin.com/feed/update/urn%3Ali%3AugcPost%3A7315610730253238272

