Emissions to Earnings: The Great P&L Reclassification.
Dr. Anju Sharma| MrsSustainability
While you are still reporting emissions… someone else is already monetizing them.
That is the silent shift triggered by India’s CCTS + BRSR Core.
This is not ESG.
This is accounting.
For decades, industrial emissions sat in the books as friction:
✗ Scrub it → OPEX bleed
✗ Report it → Compliance overhead
✗ Reduce it → Margin sacrifice
The Reclassification Has Begun
✓ Measure it → Auditable data stream
✓ Verify it → Recognized asset
✓ Register it → Tradable yield
Welcome to the MRV → Monetization Loop.
Not sustainability.
Yield engineering.
1️⃣ MRV: From Compliance to Core Infrastructure
MRV is no longer reporting.
It is revenue eligibility infrastructure.
✓ IoT + Digital Twins → Continuous emission fingerprinting
✓ Baseline Delta → Monetizable spread = (Baseline – Actual)
✓ Data Integrity Rule → No clean data = No asset = No revenue
💡 In carbon markets, truth is digitally verified.
2️⃣ Registry = Pricing Power (Not Administration)
A registry is not a backend system.
It is your pricing lens.
Registry Positioning Realized Value
Verra (VCS) Scale industrial credits $10–30/t
Gold Standard ESG premium assets $15–30/t
ACR Industrial + CCS pathways $8–20/t
Puro.earth Engineered carbon removal $100+/t
👉 Same CO₂. Different registry. Different multiple.
This is valuation arbitrage.
3️⃣ ERW: Waste → High-Value Carbon Removal
Enhanced Rock Weathering (ERW) is rewriting waste logic.
✓ Basalt + CO₂ → Permanent mineralization
✓ Industrial residues → CDR feedstock design
✓ Forward contracts → Locked-in carbon revenue
💡 This is not disposal.
This is product design for carbon markets.
4️⃣ India’s 9–18 Month First-Mover Window
CCTS is not gradual.
It is a compressed advantage window.
Winning playbook:
✓ Asset audit → Methane, WHR, efficiency
✓ Methodology lock → VM0042, CCS, ERW
✓ VVB validation → Tradability
✓ Real-time MRV → Continuous issuance
✓ Strategic trading → Profit capture
👉 Early movers won’t comply.
They will set the market.
The Uncomfortable Math
10,000 tCO₂e/year reduction:
$20/t → $200K
$100/t → $1M+
$300/t → $3M+
This is not ESG upside.
This is a hidden business unit.
The Strategic Verdict
The winners will not be the lowest emitters.
They will be the best converters.
Carbon → Inventory
MRV → Infrastructure
CCTS → Price discovery
KtalystKlues
Not: How do we reduce emissions?
But:
How do we design emissions into earnings?
Abbreviations
CCTS — India carbon market
BRSR — ESG reporting (SEBI)
MRV — Measure, report, verify
tCO₂e — Emissions unit
ERW — Rock-based carbon removal
CDR — CO₂ removal
CCS — Capture & store CO₂
VVB — Third-party verifier
VM0042 — Verra carbon method
MrsSustainability KtalystInsights KtalystKlues KtalystGreenLove Ktalyst5Ps5Es CarbonMarkets CCTS BRSR ChemicalIndustry ERW CarbonStrategy ClimateFinance Decarbonization SustainabilityStrategy IndiaGrowthStory NamasteIndia
Originally published on LinkedIn on 2026-03-30 08:26:14: https://www.linkedin.com/feed/update/urn%3Ali%3Ashare%3A7444298931783544832
📉 KtalystInsights | DigitalTwins ≠ DigitalSustainability
🧠 Just because it’s smart doesn’t mean it’s green.
Here’s the hard truth: most digital twins are data-rich but ESG-poor.
🚨 Data Points Why Digital Twins May Be Failing Sustainability
✅ ktalyst.in/: Building a Green Digital Twin?
🔍 Include live metrics for:
♻️ Carbon intensity
🌊 Water usage per unit
🌐 Scope 1–3 emissions
🔁 Circularity index
🧮 Material passports for product traceability
🔧 Deploy smartly with:
🛰 Edge computing to cut cloud emissions
🔗 Interoperable APIs to avoid siloed data
⚙️ Lifecycle dashboards aligned to ISO 14040 & ISO 23247?
🧩 Insight, not simulation. Sustainability, not just scalability.
🔑 KtalystKeystone | NamasteIndia | DigitalTwinFails | Scope3Ready | CircularManufacturing | GreenCloud | SmartButSustainable | ktalyst.in/
Originally published on LinkedIn on 2025-07-12 18:14:32: https://www.linkedin.com/feed/update/urn%3Ali%3Ashare%3A7349863753359806464
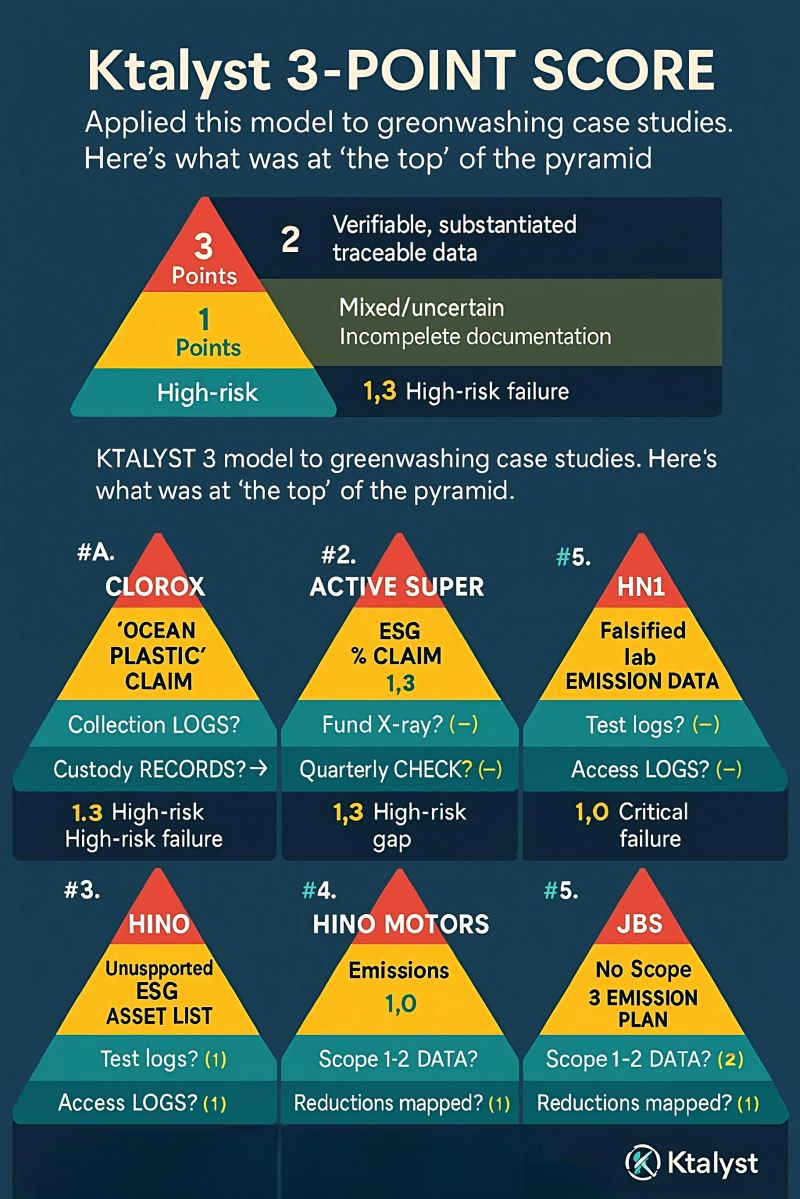
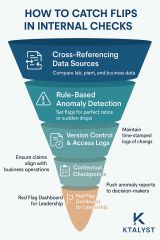
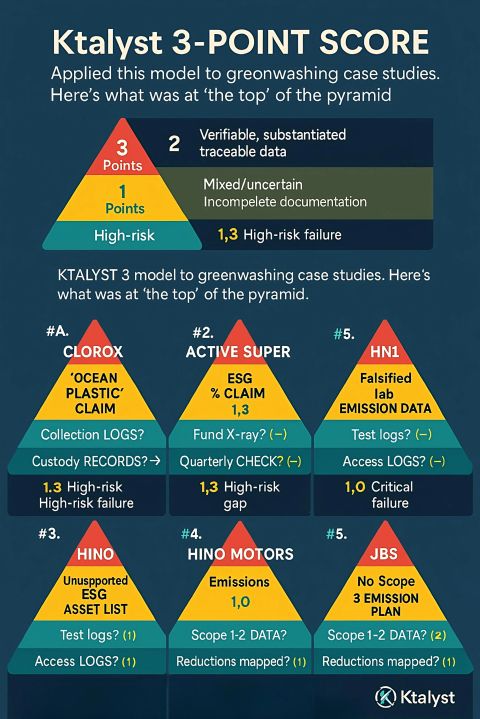
GreenwashedAndGutted | The Cost of ESG Without Checkpoints NoReadyToUse, each company NeedsToGet KtalystPatternFunnels Designed for their OwnSystems.
CutCopyPaste = Fail
I studied 5global greenwashing disasters.
The pattern# was loud and clear:
✅ Intent was strong
❌ Systems were weak
They didn’t lie. They just didn’t verify.
Clorox Australia – “Ocean Plastic” That Never Saw the Sea
Claim: GLAD bags made from 50% ocean plastic
Truth: Plastic came from inland villages, nowhere near the coast
I 🧭 Geo-tagged collection logs to confirm coastal origin
🔗 Chain-of-custody tracking from pickup to processing
📦 Batch linkage system to connect source with product
Active Super – Ethical Fund, Ethical Gaps
Claim: No investments in coal, tobacco, or gambling
Truth: Audit revealed exposure to all three
🗺️ Live ESG mapping between fund positions and exclusion list
⏰ Quarterly auto-checkpoints for compliance assurance
🚨 Real-time breach alerts to flag policy violations
II DWS Group – 50% ESG. But Verified by Whom?
Claim: Half the portfolio was ESG-compliant
Truth: Many assets lacked certified ratings
📝 Third-party score integration with time-stamped logs
⛔ Expiry flags for outdated or unverifiable claims
🌡️ Portfolio heatmap to track low-certainty zones
III Hino Motors – When the Lab Fakes Clean Air
Claim: Vehicles passed emissions testing
Truth: Over 100,000 units involved in data manipulation
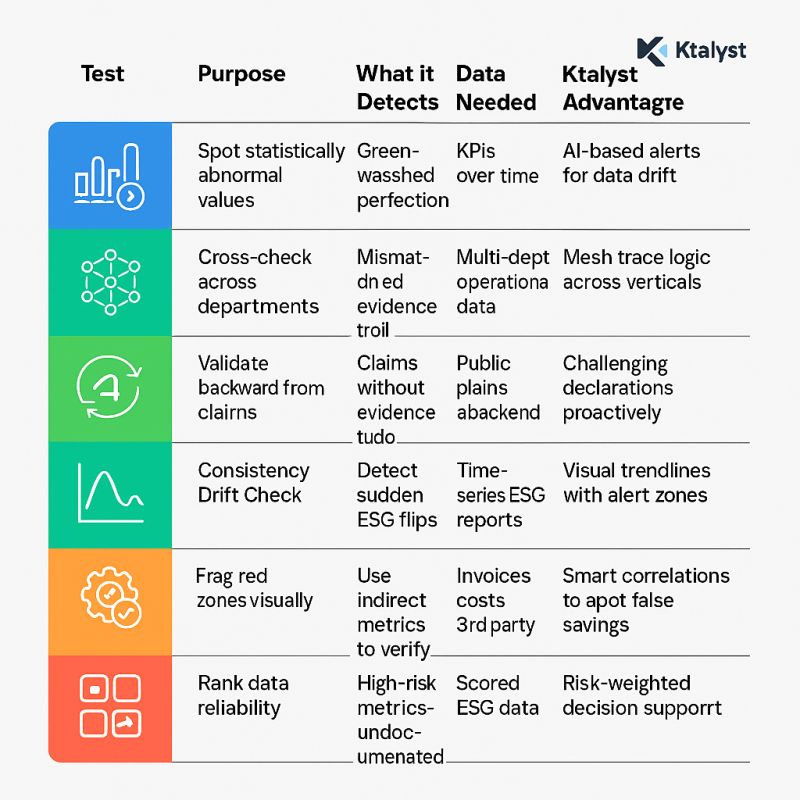
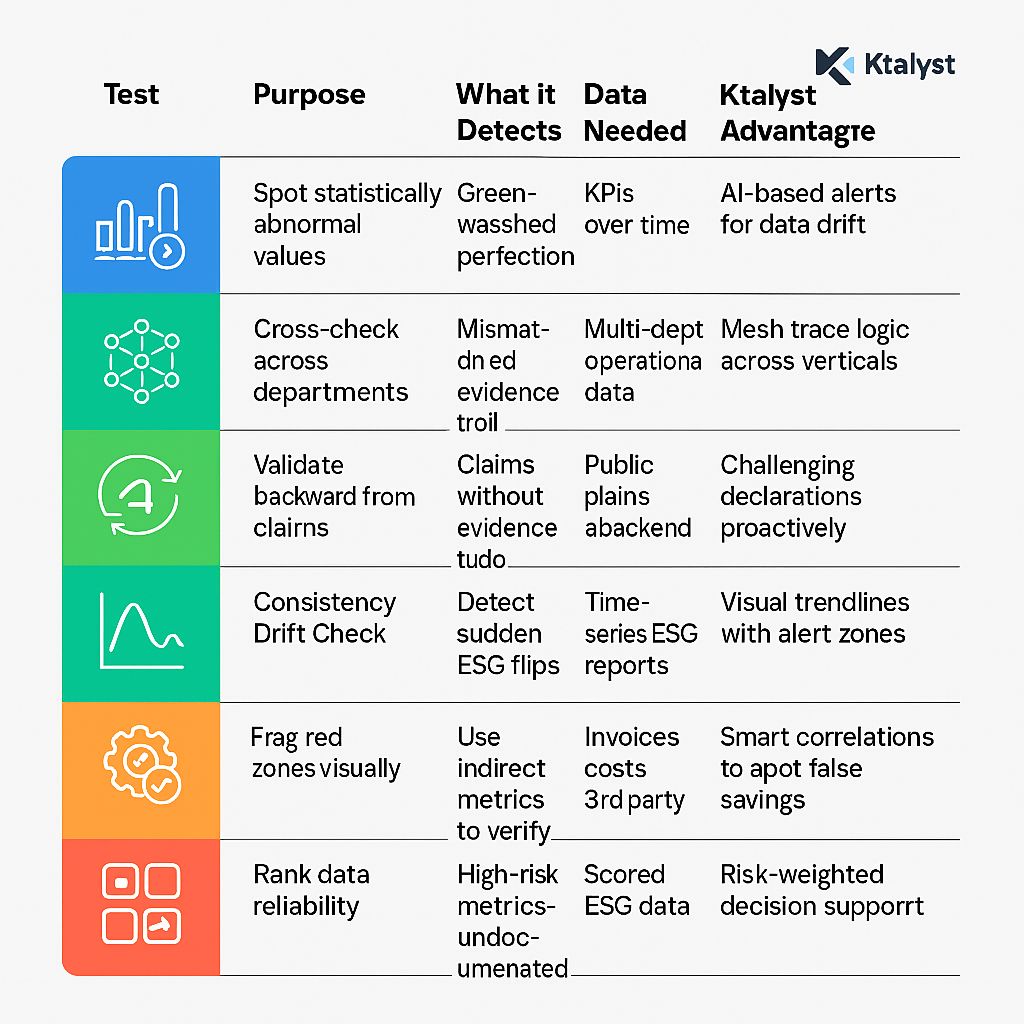
📊 Time-stamped lab audit trails
🔁 Cross-verification with actual plant output
🔐 Anomaly triggers and access control logs
IV JBS – Net Zero, But Where’s the Map?
Claim: Net Zero by 2040
Truth: No Scope 3 data, no implementation roadmap
🌍 Emission mapping tools across operations & vendors
🔗 Syncing declarations to backend data
📉 Red flag dashboards for leadership visibililty.
KtalystKeystone Takeaway:
They weren’t caught greenwashing.
They were caught assuming—without systems to validate their ESG story.
> “Sustainability isn’t a slogan. It’s a supply chain of truths.
Ktalyst Keystone
CleanClaimsOnly | PoweredByKtalyst


Originally published on LinkedIn on 2025-04-15 05:23:10: https://www.linkedin.com/feed/update/urn%3Ali%3AgroupPost%3A82951-7317779497859096578
Spinning_the_Lie? or Truth_on_Hangers: The Hidden Cost of Greenwashing in Fashion
They say it’s “eco”, “sustainable”, “planet_positive”—but all it does is spin.
From glossy tags to green-toned labels, today’s fashion isn’t always clean—it’s just dry-cleaned of accountability.
Welcome to the age of GreenwashingFashion, where the truth gets neatly pressed, hung on a rack, and sold to well-meaning consumers.
Let’s Air the Dirty Laundry:
📊 78% of global consumers consider sustainability when making purchases (McKinsey, 2023)
⚠️ But 68% of green_claims in fashion are misleading or unverifiable (EU Commission, 2024)
🌊 The industry uses enough water annually to fill 32 million Olympic-sized pools
🌫️ Responsible for 10% of global carbon emissions, making it one of the dirtiest sectors on Earth
🚨 Brands Caught in the Spin Cycle:
👕 H&M
🧺 Claimed: “Conscious Collection” was sustainable
⚖️ Reality: Generic labeling, synthetic fabrics, lawsuits in NY & EU
👖 ASOS
🧺 Claimed: “Eco Edit” line was better for the planet
⚖️ Reality: Pulled by the UK’s CMA for lack of transparency
👚 Boohoo
🧺 Claimed: “Ready for the Future” line was sustainable
⚖️ Reality: Green-themed designs without supply chain reforms
👗 Zara’s “Join Life
🧺 Claimed: Eco-conscious designs
⚖️ Reality: No clear third-party audits or traceable sustainability standards
💥 Consequences Are Mounting:
🔍 GenZ and Millennials are calling out greenwashing—over 60% have dropped brands due to false claims
💸 $1.5 billion in ESG fund outflows linked to greenwashing fears (Morningstar, 2023)
⚖️ New EU laws in 2025 to penalize misleading claims—up to 4% of annual revenue
🌀 The Satire Behind the Spin
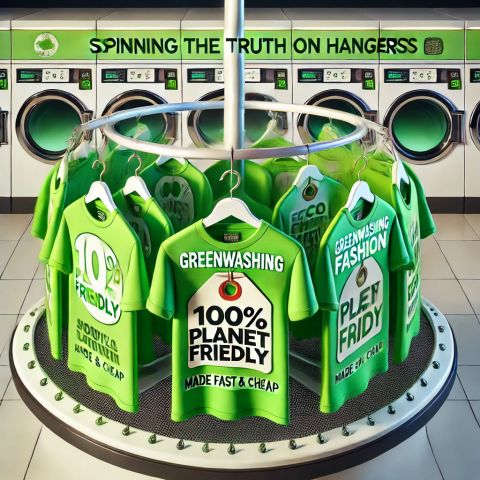
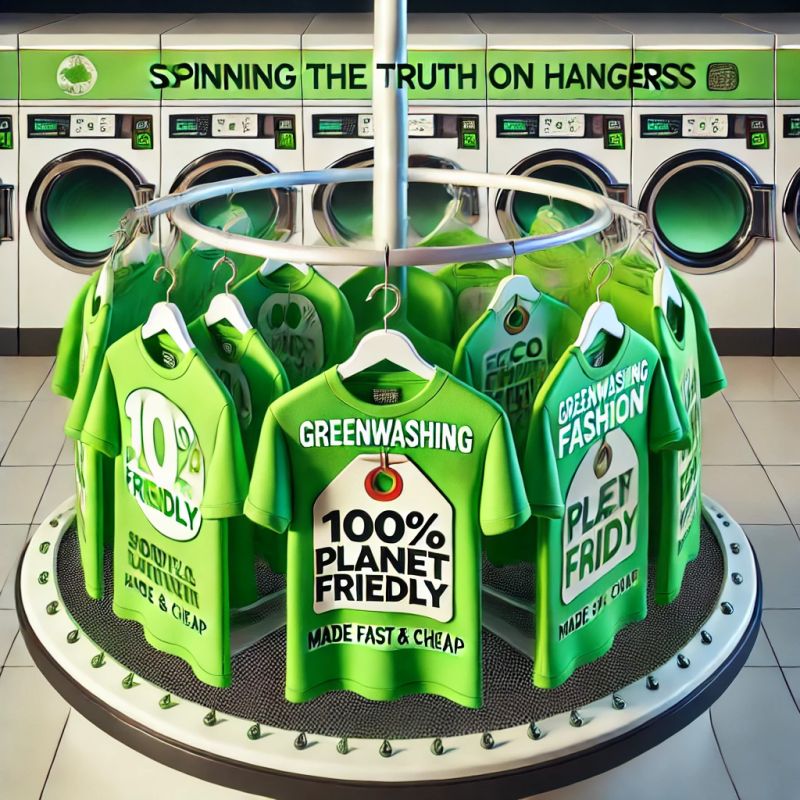
Green shirts on a dry-cleaning carousel, twirling with eco-labels…
But peek behind the tag, and it reads:
Made Fast & Cheap.
That’s not sustainability. That’s salesmanship in disguise.
FinalThoughts:
In 2025, greenwashing is no longer clever branding.
It’s a credibility killer.
If your fashion isn’t as clean as your copy—
your customers will air it out for you.
SpinningTheTruthOnHangers
GreenwashingFashion
EcoExposed
SustainableOrSuspicious
ESGMarketingEthics
FashionFraudAlert
TransparencyIsTrending

Originally published on LinkedIn on 2025-03-25 05:33:01: https://www.linkedin.com/feed/update/urn%3Ali%3AgroupPost%3A150544-7310171834031783936
🚨 Moody’s & Sustainability: ESG is Now a Credit Rating Factor! 📊💚
With #$40T in ESG assets under management, Moody’s is reshaping how financial markets assess creditworthiness. No longer just about profits & losses, a company’s sustainability risks now directly impact credit ratings, borrowing costs, & investment potential.
🔍 How Moody’s Integrates Sustainability into Credit Ratings
🟢 ESG factors impact the credit ratings of 18% of companies & governments rated by Moody’s. (Source)
📊 Issuer Profile Scores (IPS): Measures 15 ESG subfactors (climate risk, governance strength, social responsibility).
📊 Credit Impact Scores (CIS): Rates how ESG performance affects a company’s credit rating & risk profile.
📊 Second Party Opinions (SPOs): Validates Green Bonds & Sustainability-Linked Loans, ensuring funds are climate-aligned.
🔹 Moody’s now assesses over 3,000 entities based on ESG factors.
💰 ESG & Financial Impact: Why Credit Ratings Depend on Sustainability
🏦 Banks & Investors Are Watching
📌 Companies with poor ESG ratings face higher borrowing costs, as investors demand sustainability-linked loans & bonds.
📉 Carbon-Intensive Companies Are High-Risk
📌 Firms with high Scope 3 emissions face 15-20% valuation risks due to carbon pricing & regulatory changes. (Source)
🚀 Sustainability-Linked Bonds & Loans Are Surging
📌 #$1.6T in sustainability-linked bonds & loans have been issued, with Moody’s validating green claims to prevent greenwashing. (Source)
🌍 Moody’s ESG Leadership: Recognitions & Market Influence
🏆 FTSE4Good Index Inclusion (6 Years Running) → Recognizing top ESG performers.
🏆 EcoVadis Bronze Medal → Top 35% of global companies for sustainability.
🏆 CDP Supplier Engagement Leader → Among the top 4% of companies driving supply chain decarbonization. (Source)
🔥 The Takeaway: Sustainability is No Longer Optional
🟢 18% of Moody’s rated companies now have ESG-driven credit adjustments.
🟢 Investors demand transparent sustainability metrics before lending.
🟢 Greenwashing is no longer profitable—credit ratings now hold companies accountable.
📢 Should ESG be an even bigger factor in credit ratings? Let’s discuss below! 👇

Originally published on LinkedIn on 2025-02-27 04:39:26: https://www.linkedin.com/feed/update/urn%3Ali%3AgroupPost%3A82951-7300736262829711360
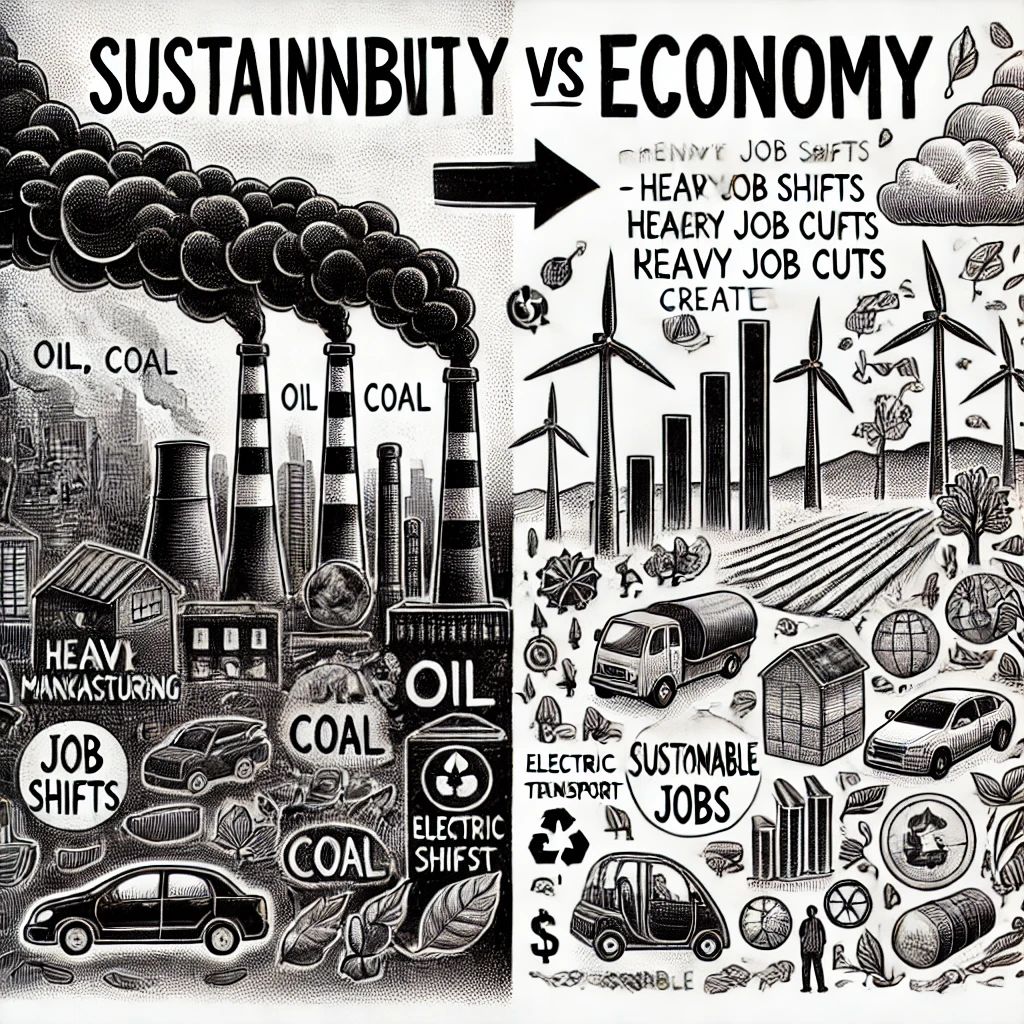
🚨 “TheGreenParadox: If the Top100 Polluters Go Green, Do Economies Go Red?” 🌍💸🔥
71% of global emissions come from just Just100 companies—but what happens if they actually go green?
📊 TheHardNumbers: Who’s Driving Emissions?
🔹 100Companies = 71% of Global Emissions (CDP Carbon Majors Report, 2025)
🔹 TotalMarketValue = $15.4 Trillion (Forbes, 2025)
🔹 Sectors Dominating Emissions:
✔️ Oil & Gas (ExxonMobil, Shell, Aramco, BP, Reliance) – 52% of global industrial CO₂.
✔️ Coal Giants (ChinaEnergy, Peabody, Glencore) – 14% of all emissions, powering entire nations.
✔️ Steel & Cement (ArcelorMittal, Holcim, TataSteel, JSW) – 8% of emissions, critical to infrastructure.
✔️ Shipping & Aviation (Maersk, Boeing, Delta, Emirates) – 5% of emissions, enabling global trade.
🚨 RealityCheck: Transitioning these industries overnight would shake economies to the core.
💰 TheEconomicCrashPotential
🔻 JobLosses in FossilFuel Sectors – 34M jobs globally depend on oil, coal, and heavy industries. (ILO, 2025)
🔻 GDPImpact on EmergingMarkets – India, China, and Indonesia rely on fossilfuels for 20-35% of GDP. (World Bank, 2025)
🔻 SupplyChain Disruptions – 42% of global logistics, steel, and chemicals are tied to high-emission industries. (McKinsey, 2025)
🔻 EnergyTransition Costs – Full decarbonization needs #$275T investment by 2050—but who’s paying? (IEA, 2025)
📌 TheDilemma: Accelerating sustainability risks a financialcrisis, while delaying it fuels climate disaster.
🔄 IsThereAMiddlePath?
🏆 IndustriesFindingBalance:
✅ SaudiAramco’s CarbonCapture Push – #$50B invested, but still expanding fossilfuel extraction.
✅ Tesla & BYD’s EVRevolution – EVs now 18% of global carsales, but lithiummining is a sustainability disaster.
✅ GreenSteel Investments (Hybrit, H2GreenSteel) – Promising tech, but adoption is too slow.
🚨 TheProblem: Green initiatives often don’t move fast enough—or they create new environmental costs.
🏆 KeyTakeaway: The TradeOff No One Wants to Talk About
📌 GoingGreen could be an economic revolution if planned strategically.
📌 ItShouldBe a shift that protects jobs, not eliminates them overnight.
📌 ItWouldBe an economicdisaster if industries collapse before sustainable alternatives scale.
👉 CanTheWorldAffordToDecarbonize without crashing economies? Drop your insights below! 👇
Originally published on LinkedIn on 2025-02-20 03:57:07: https://www.linkedin.com/feed/update/urn%3Ali%3AgroupPost%3A82951-7298188896939479040
🌍 Agriculture & Deforestation: The_Silent_Climate_Bomb
💡 NetZero is impossible without fixing Food & Land Use.
🔥 AFOLU (Agriculture, Forestry & Land Use) fuels 18-20% of global emissions—outpacing global transport, steel, and cement.
🚨 Yet, it’s under_discussed. The world’s biggest climate culprit is on your plate.
🌲 Deforestation – 10% of Global CO₂ Emissions
🟢 Tropical forests store 7.6B metric tons of CO₂ annually.
🔴 Clearing them releases 1.5B metric tons/year—more than Japan’s total emissions.
⚠️ 80% of Amazon deforestation is for cattle grazing & soy farming.
🐄 Livestock Methane – 6% of Global Emissions
🐂 1.5B cows = 100M metric tons of methane annually—more than all planes, cars & ships combined.
🔥 Methane is 28x stronger than CO₂ and rising fast.
🚨 Beef production alone is responsible for 41% of all livestock-related emissions.
🌾 Fertilizers & Soil_Emissions – 2-4% of Global GHGs
💥 N₂O is 265x worse than CO₂. It lingers for over 100 years.
🌎 China & India = 30% of global N₂O emissions—driven by excessive synthetic fertilizers.
💧 Runoff pollutes rivers, destroys soil, and creates oceanic dead zones.
✅ Climate Solutions with Real Impact
🌱 Reforestation & Agroforestry → Could offset 10-15% of global CO₂ annually.
🐄 Seaweed Feed for Cows → Reduces methane by 30-80%.
🌾 Precision Farming & Organic Alternatives → Cuts fertilizer emissions by 50%.
🍽️ DietShift (10% Less_Meat Globally) → Slashes methane by 60M metric tons.
📢 The food system is broken. The solution isn’t just electric cars—it’s on your plate.
🚀 Policy, investment & consumer choices must change—NOW.

Originally published on LinkedIn on 2025-02-12 14:43:03: https://www.linkedin.com/feed/update/urn%3Ali%3Ashare%3A7295452348695388160
NamasteCarbonPricingIndia:
The_State_of_Carbon_Pricing_2024: Progress, Disparities, and Where India Fits
The YR2024 State and Trends of Carbon Pricing Report highlights both progress and challenges in global carbon pricing as governments strive to meet the Paris Agreement’s goals. With 75 carbon pricing instruments now operational—39 carbon taxes and 36 emissions trading systems (ETSs)—the landscape is evolving, yet significant gaps in pricing levels and emissions coverage remain.
Global Carbon Pricing: The Leaders
Countries exceeding the $80-$100/ton threshold, recommended to limit global warming, are setting the benchmark:
Uruguay: $167/ton – The world leader, powered by its renewable energy dominance.
Switzerland: $132/ton – Among Europe’s most ambitious nations.
Sweden: $127/ton – Achieved a 33% emissions reduction since 1991.
Norway: $108/ton – Balances oil exports with green innovation.
These leaders leverage carbon pricing to fund renewables, incentivize green practices, and drive significant emissions reductions.
Falling_Short: Countries Below $40/ton
Despite the expanding reach of carbon pricing, many nations are still underpricing emissions, limiting their impact:
California (USA): $39/ton – Gradual cap-and-trade implementation.
Japan (Tokyo): $37/ton – Focused on innovation but still below target.
India: $5/ton – A coal cess aimed at balancing affordability and emissions reductions.
Currently, only 23% of global emissions are covered by these instruments, leaving significant gaps in global climate action.
Where India Stands
As the third-largest emitter globally, India represents a critical player in the future of carbon pricing:
$5/ton Carbon Price: Through its coal cess, generating $3 billion annually for renewable energy initiatives.
National Carbon Market: Launched in 2023 to facilitate voluntary carbon trading, with potential for scaling.
500 GW Renewable Energy Target: India is undergoing one of the world’s fastest energy transitions, underscoring its commitment to sustainability.
Carbon Credit Leader: Indian projects dominate voluntary markets, showcasing the country’s capacity to innovate in carbon offsets.
India’s current pricing is modest but represents a foundation for growth. By gradually scaling its carbon price and expanding the carbon market, India can harmonize economic growth with climate goals.
The Way Forward
Carbon pricing is a powerful tool, but the global average remains far below the $80-$100/ton threshold needed to limit warming to 1.5°C. For nations like India, leveraging mechanisms such as renewable energy investments, carbon markets, and circular economy practices can drive impactful change while balancing affordability and growth.
Originally published on LinkedIn on 2024-12-19 20:26:43: https://www.linkedin.com/feed/update/urn%3Ali%3AgroupPost%3A59930-7275607502493278209
NamasteFarmerIndia Myths_vs_Concerns Punjab government’s plan to establish 39 compressed biogas (CBG) projects has faced significant_challenges, including administrative hurdles and protests from farmer unions. Farmers have raised concerns about the potential carcinogenic effects of chemicals produced during biogas generation and the possibility of soil contamination.
Farmers’ concerns about carcinogenic_factors revolve around emissions from biogas_engines, which can include polycyclic aromatic hydrocarbons (PAHs), aldehydes, dioxins, & furans.
Studies have shown that while PAHs, aldehydes, and dioxins are often below_detection limits in biogas_exhausts, the equivalent toxicity of dioxins and furans in biogas can be significantly higher compared to natural gas. Additionally, nitrogen oxides (NOx) and sulfur oxides (SOx) in biogas exhausts are higher than those in natural gas, contributing to human health damage.
Alternatives to CBG_projects for managing paddy straw and other agricultural residues:
Biochar Production: Converting paddy straw into biochar through pyrolysis can improve soil health and sequester carbon, reducing greenhouse gas emissions.
Pelletization: Paddy straw can be converted into pellets and used as a fuel for industrial boilers and power plants, providing a renewable energy source.
Composting: Composting paddy straw can produce organic fertilizer, enhancing soil fertility and reducing the need for chemical fertilizers.
Mushroom Cultivation: Paddy straw can be used as a substrate for mushroom cultivation, providing an additional income source for farmers.
Insitu_Decomposition: Using microbial solutions to decompose paddy straw in the field can enrich the soil with organic matter and nutrients.
Bioethanol_Production: Converting paddy straw into bioethanol can provide a renewable fuel source, reducing dependence on fossil fuels.
Balancing the need for sustainable solutions to paddy_straw_burning with the health and environmental concerns of local communities is crucial.
Construction of CBG_plants, it is possible to design_operate them in a manner that minimizes the risk of harmful_emissions. This can be achieved through:
Advanced_Emission_Control Technologies: like catalytic converters, scrubbers, and filters can significantly reduce the emission of harmful pollutants.
Proper_Maintenance_Monitoring: biogas plants can ensure that they operate efficiently and within safe emission limits
Use_Cleaner_Feedstock: Using cleaner and well-prepared feedstock can reduce the formation of harmful by-products during the biogas production process.
Adopting_Best_Practices: Following best practices in plant design, operation, and management can help mitigate the risks associated with biogas production.
Originally published on LinkedIn on 2024-09-12 14:07:38: https://www.linkedin.com/feed/update/urn%3Ali%3AgroupPost%3A60128-7239998095776747521
NamasteIndia reads Fashion industry is a significant contributor to global greenhouse gas (GHG) emissions, accounting for an estimated 3% to 8% of the total¹.
Many fashion brands are struggling to meet their decarbonization targets¹².
High Emissions: The fashion industry emits around 2.1 billion metric tons of GHGs annually².
Decarbonization Challenges: About two-thirds of fashion brands are behind on their decarbonization schedules, with 40% seeing an increase in emissions since making sustainability commitments¹.
Supply Chain Impact: A significant portion of emissions comes from the supply chain, particularly in manufacturing countries like Bangladesh, China, India, and Vietnam¹.
Collaborative Efforts: Bestseller, Gap Inc., H&M Group, and Mango, are collaborating to share the costs and responsibilities of reducing CO2 emissions in the supply chain⁴⁹.
References
(1) Sustainable style: How fashion can afford decarbonization | McKinsey. https://lnkd.in/d3p8jfEx.
(2) How the fashion industry can reduce its carbon footprint | McKinsey. https://lnkd.in/dyRsnJd5.
(3) Fashion Giants Join Forces to Share Cost of Supply Chain …. https://lnkd.in/dU5N8JHe.
(4) Major brands commit to innovative collective financing model to …. https://lnkd.in/dFQ9_tm6.
(5) Six cost-effective ways fashion brands can decarbonise. https://lnkd.in/dcf6FEg2.
(6) Fashion brands, part of high-emitting industry, hide decarbonisation plans. https://lnkd.in/dGsgY246.
(7) Why fixing fashion’s pollution crisis requires big brands to share the cost. https://lnkd.in/ddMFsiET.
(8) Six cost-effective ways fashion brands can decarbonise – MSN. https://lnkd.in/dqxc9rp8.
(9) Fashion brands falling behind on decarbonisation targets. https://lnkd.in/dhBSVZFw.
(10) Fashion Brands Unite To Decarbonise The Sector. https://lnkd.in/dnGh7vQH.
https://lnkd.in/d3p8jfEx
Originally published on LinkedIn on 2024-08-09 20:42:21: https://www.linkedin.com/feed/update/urn%3Ali%3AgroupPost%3A2474261-7227776240793866240

