TheSolarParadox: Is Your Roof Unemployed?
Dr. Anju Sharma•MrsSustainability
NamasteIndia, a 124.53 GW clue is hiding in plain sight.
As of 31 March 2026, India’s cumulative solar capacity reached 150.26 GW. Yet only 25.73 GW came from grid-connected rooftop solar, while 114.87 GW came from ground-mounted systems.
The IEA says distributed solar PV will drive 42% of total PV expansion during 2025–2030. Rooftop solar is no longer a side character. It is moving into a lead role.
1. The strategygap is not sunlight. It is placement.
✓ scout hectares
✓ chase approvals
✓ build long transmission links
Meanwhile, roofs, warehouses, factories, malls, schools, hospitals, and parking lots sit in full sunlight like idle capital with no KPI pressure.
x more land conflict
x more transmission burden
x more friction
Fields should grow food. Roofs should grow power.
2. The CFO math gets the roof promoted.
Take a 100 kW rooftop system:
✓ generation: ~4.2 lakh kWh/year
✓ tariff: ₹8 per unit
✓ avoided power cost: ₹33.6 lakh/year (~USD 40,000)
4,20,000 × ₹8 = ₹33,60,000
Suddenly, the roof is no longer overhead.
It is on payroll.
3. Carbon gives the roof a second job.
Using the CEA grid emission factor of 0.716 tCO2/MWh, a 100 kW rooftop system avoiding 420 MWh/year can avoid about 300.7 tCO2 annually.
✓ 420 × 0.716 = 300.7 tCO2/year
So the roof now does two jobs:
✓ cuts the electricity bill
✓ cuts the carbon load
That is better output than half the meetings on most calendars.
4. Policy opened the door. Business must walk in.
The MNRE Grid Connected Rooftop Solar Programme targeted 40,000 MW of cumulative rooftop capacity, with Phase II running till 31 March 2026.
Against that, India’s 25.73 GW rooftop base says one thing clearly:
✓ sunlight exists
✓ surfaces exist
✓ economics increasingly exist
x urgency to use dead concrete intelligently
Execution is the missing panel.
5. Parking lots deserve a promotion too.
A parking lot without a solar canopy is:
x a heat trap
x a tyre toaster
x a wasted surface
Add a canopy and it becomes:
✓ shade
✓ on-site power
✓ EV charging support
✓ lower heat load
✓ better land-use efficiency
Now that is a career upgrade.
KtalystShuttleStrategy
Maximize grey or dormant assets.
Turn idle surfaces into lower power cost, lower carbon load, stronger ESG, and possible carbon-credit upside.
When dead concrete starts delivering live returns, strategy has finally woken up.
Final KtalystKlue™
A bare roof in 2026 is not neutral.
It is a failure of spatial intelligence.
Stop looking at the horizon.
Look up.
Your roof is not waiting for sunlight.
It is waiting for a promotion.
StepUpRoofs
Your roof can pay your electricity bill, cut your carbon load, and finally make concrete earn its keep.
MrsSustainability KtalystInsights™ KtalystKlues™ KtalystKeystone KtalystShuttleStrategy EnergyStrategy FiscalDiscipline Ktalyst5Ts Ktalyst5Ps5Es DataComa KtalystGreenLove
Originally published on LinkedIn on 2026-04-10 05:01:27: https://www.linkedin.com/feed/update/urn%3Ali%3Ashare%3A7448233663873474560
Trends AI2050: Monetization_Meets_Carbon_Accountability
By 2050, it’s Human Judgment vs AI Emission Math for Scope3 Catagory_11
Dr. Anju Sharma
In the decade ahead, AI market leadership won’t be defined solely by innovation or user base — it will be shaped by how platforms monetize profitably while controlling Scope 3 emissions across a vastly expanded global footprint.
Trend_1 — AI Giants Under Full Scope 3 Scrutiny
By the early 2040s, SEC climate disclosure rules will be fully in force. The 14 US-headquartered AI leaders that dominate today will publish emissions per user & per dollar of revenue. The era of “revenue without carbon math” over.
Trend_2 — Early Compliers Become Global Low-Carbon Benchmarks
EU pioneers (DeepL, Remove.bg) & Australia’s Canva, in mandatory regimes in 2030, will enter the 2040s with carbon-efficient infrastructure & per-transaction emissions tracking as a standard. By 2050, these early moves will give them pricing & market access advantages in regulated markets.
Trend_3 — Asia’s Scale Redefines Risk and Reward
By 2050, Asia’s digital user base to exceed 5 billion, with India, China, Indonesia, & SE Asia as the epicenter of AI consumption.
Upside: Subscription & API models thrive on scale.
Challenge: Without fully renewable-powered hosting & optimized inference, downstream Scope 3 footprints surge alongside adoption.
Trend_4 — Monetization Models Hardwire Carbon Profiles
The link between how AI earns and where its carbon sits becomes non-negotiable:
Mass-Market Subscriptions → downstream-heavy (user devices, data transfer).
Enterprise-Integrated → upstream-heavy (chips, data centers).
Niche/API Models → high carbon per paying user, compute-intensive but smaller volume.
Trend_5 — Carbon Intensity Becomes a Public Ranking Metric
By mid-2040s, kg CO₂e per paying user sits beside ARR in annual reports and investor dashboards. By 2050, AI companies ranked globally on carbon productivity as fiercely as they are on market share.
Trend_6 — Compute Infrastructure Becomes the Decarbonization Frontier
Next-gen AI chips and quantum-hybrid servers dominate the upstream Scope 3 debate. Companies that green their compute stack through renewable-powered data centers, recyclable chip materials, and modular server life extension set the industry’s carbon floor.
Trend_7 — Policy Convergence Creates a Global Compliance Grid
By 2050, Scope 3 disclosure frameworks from the Globally to have converge on harmonized reporting metrics. This allows investors to directly compare carbon efficiency between AI companies in Stock Markets
AbbreviationGuide
AI:Artificial Intelligence
Scope 3:Indirect Greenhouse Gas Emissions in the value chain (beyond direct operations)
SEC:U.S. Securities & Exchange Commission
EU:European Union
ARR:Annual Recurring Revenue
kg CO₂e – Kilograms of Carbon Dioxide Equivalent
API:Application Programming Interface
KtalystInsights | MrsSustainability | AI | Scope3 | NamasteIndia
Originally published on LinkedIn on 2025-08-13 10:39:24: https://www.linkedin.com/feed/update/urn%3Ali%3AgroupPost%3A82951-7361345626162323457
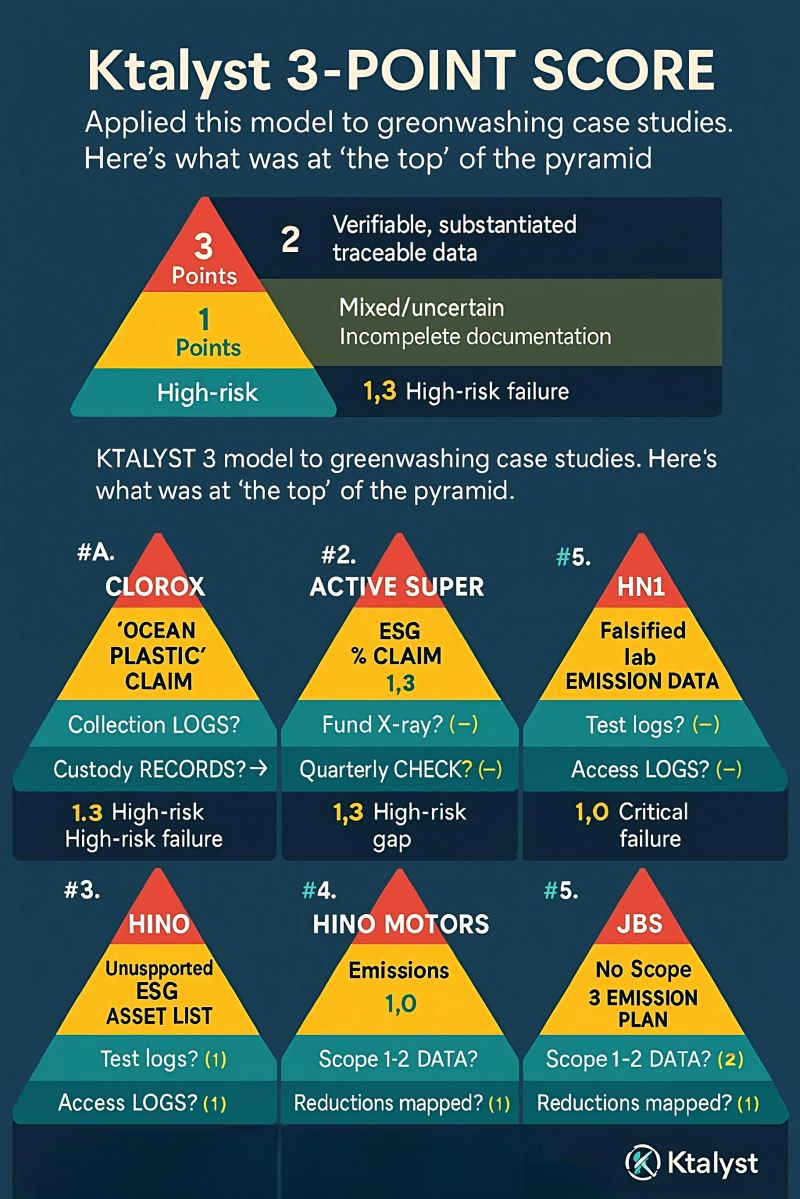
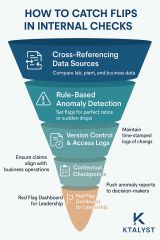
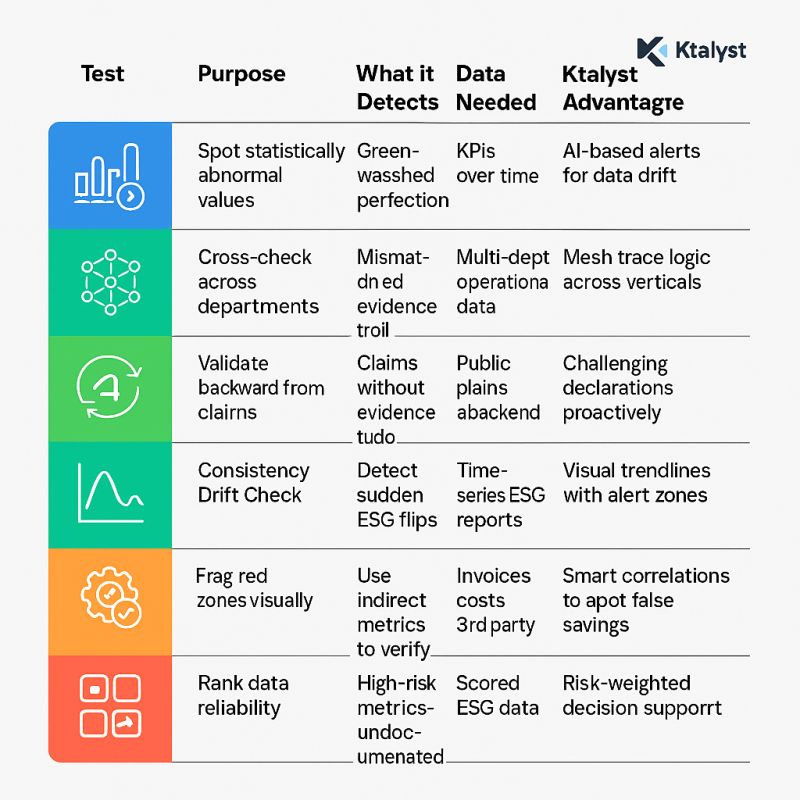
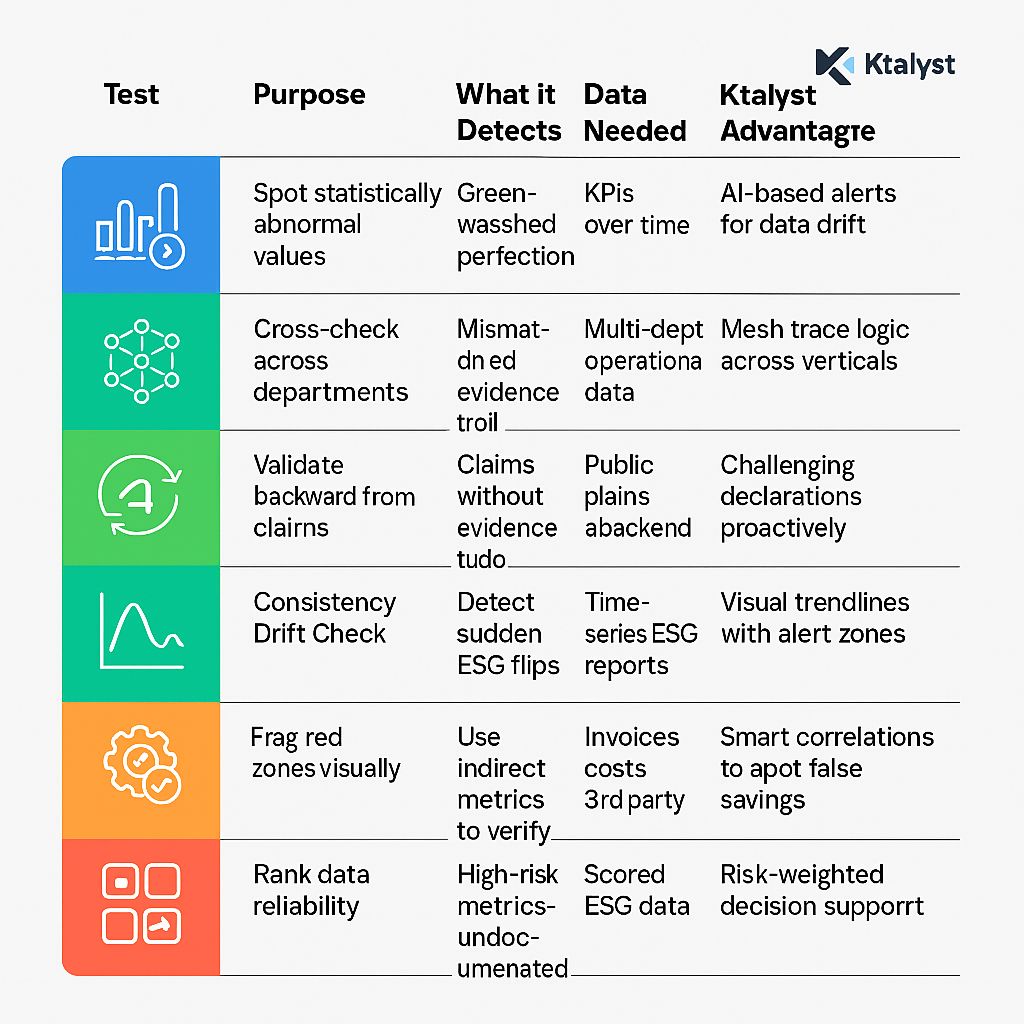
GreenwashedAndGutted | The Cost of ESG Without Checkpoints NoReadyToUse, each company NeedsToGet KtalystPatternFunnels Designed for their OwnSystems.
CutCopyPaste = Fail
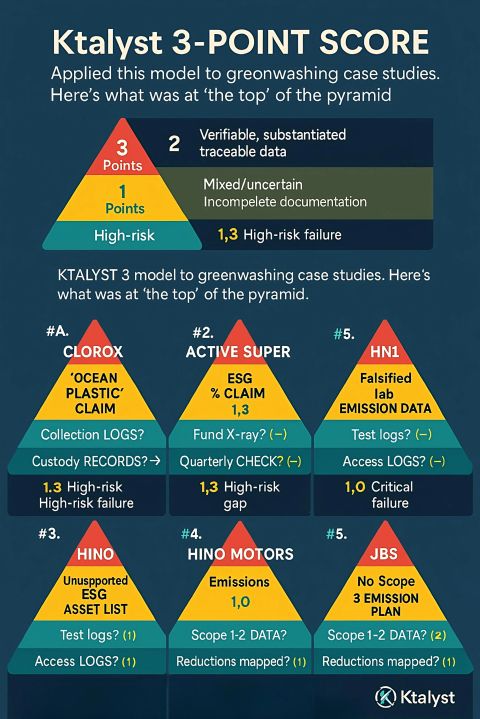
I studied 5global greenwashing disasters.
The pattern# was loud and clear:
✅ Intent was strong
❌ Systems were weak
They didn’t lie. They just didn’t verify.
Clorox Australia – “Ocean Plastic” That Never Saw the Sea
Claim: GLAD bags made from 50% ocean plastic
Truth: Plastic came from inland villages, nowhere near the coast
I 🧭 Geo-tagged collection logs to confirm coastal origin
🔗 Chain-of-custody tracking from pickup to processing
📦 Batch linkage system to connect source with product
Active Super – Ethical Fund, Ethical Gaps
Claim: No investments in coal, tobacco, or gambling
Truth: Audit revealed exposure to all three
🗺️ Live ESG mapping between fund positions and exclusion list
⏰ Quarterly auto-checkpoints for compliance assurance
🚨 Real-time breach alerts to flag policy violations
II DWS Group – 50% ESG. But Verified by Whom?
Claim: Half the portfolio was ESG-compliant
Truth: Many assets lacked certified ratings
📝 Third-party score integration with time-stamped logs
⛔ Expiry flags for outdated or unverifiable claims
🌡️ Portfolio heatmap to track low-certainty zones
III Hino Motors – When the Lab Fakes Clean Air
Claim: Vehicles passed emissions testing
Truth: Over 100,000 units involved in data manipulation
📊 Time-stamped lab audit trails
🔁 Cross-verification with actual plant output
🔐 Anomaly triggers and access control logs
IV JBS – Net Zero, But Where’s the Map?
Claim: Net Zero by 2040
Truth: No Scope 3 data, no implementation roadmap
🌍 Emission mapping tools across operations & vendors
🔗 Syncing declarations to backend data
📉 Red flag dashboards for leadership visibililty.
KtalystKeystone Takeaway:
They weren’t caught greenwashing.
They were caught assuming—without systems to validate their ESG story.
> “Sustainability isn’t a slogan. It’s a supply chain of truths.
Ktalyst Keystone
CleanClaimsOnly | PoweredByKtalyst


Originally published on LinkedIn on 2025-04-15 05:23:10: https://www.linkedin.com/feed/update/urn%3Ali%3AgroupPost%3A82951-7317779497859096578
IndiaAtCOP26: Are We Walking the Talk — or Just Talking the Talk?
You cannot greenwash a deadline. Climate targets don’t wait, and neither should leadership.
Anju Sharma
In 2021, India made a powerful promise to the planet.
By 2025, the applause has faded. It’s time for accountability — not just ambition.
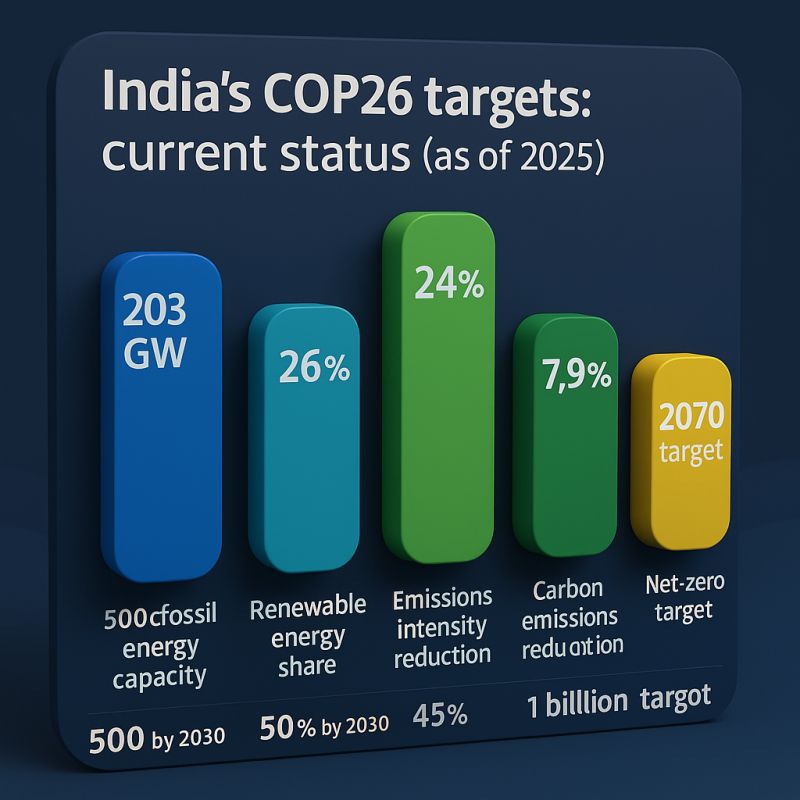
The 5Targets. The 5Year Reality Check:
🔋 500 GW Non-Fossil Energy by 2030
✅ 203.18 GW achieved (as of Oct 2024)
⚠️ Slowing pace. Grid and land hurdles choking large projects.
⚡ 50% Power from Renewables
✅ 26% YoY growth in clean energy (Jan 2025)
⚠️ Rooftop solar under 15% of target. State policies? All over the place.
📉 45% Emission Intensity Cut by 2030
✅ 33% achieved
⚠️ Driven by GDP growth — not aggressive emissions management.
🌫️ 1 Billion Tonnes CO₂ Reduction by 2030
✅ 7.9% drop in 2020
⚠️ But coal production surged 9% in 2024. Net gains? Neutralized.
🕰️ Net-Zero by 2070
✅ Roadmap submitted.
⚠️ No sectoral mandates. No accountability. No serious momentum.
Where’s the Leadership?
🚫 Ministries in silos
🚫 Power sector still fossil-heavy
🚫 EV infra crawling
🚫 Agriculture untouched
Are we really driving the transition — or just riding a global narrative?
And the Money?
💰 India has raised billions — Green Bonds, FDI, PLI schemes…
But…
❌ Utilization = uneven
❌ Outcome tracking = missing
❌ Impact per rupee = unclear
The climate rupee has wings — but no flight path.
The Fix — And Fast
✅ Appoint sector-wise climate champions with KPIs
✅ Launch public climate spend dashboards (Geo-tagged)
✅ Train bureaucrats in ESG, climate finance & tech
✅ Incentivize state-wise performance on climate goals
At_This_Pace, Where_Will_We_Land?
⏳ 3/5 targets may be missed
⏳ Investor confidence may fade
⏳ India’s brand as a climate leader may turn into a paper tiger
India doesn’t lack ambition.
It lacks the fire to deliver.
Time to shift gears.
From policy promises to powerful performance.
Originally published on LinkedIn on 2025-03-30 11:31:32: https://www.linkedin.com/feed/update/urn%3Ali%3AgroupPost%3A4385073-7312073993270784000
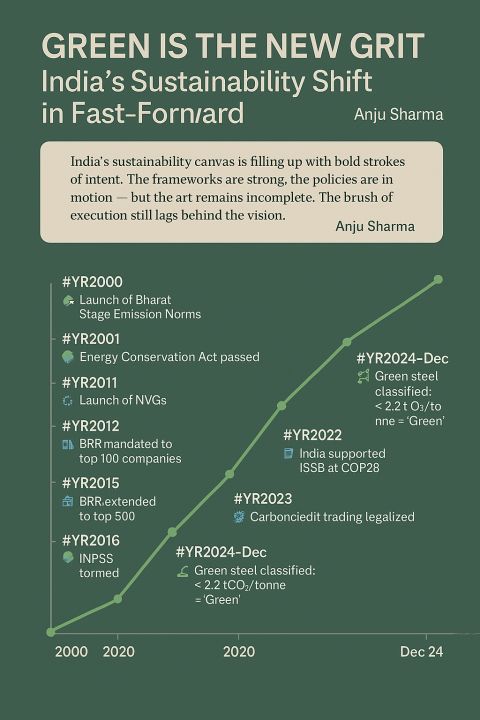
GreenIsTheNewGrit
India’s Sustainability Shift in Fast-Forward
From bold emission norms to ESG disclosures, India’s journey toward sustainability is accelerating — on paper.
But as we move from intent to impact, it’s clear that what’s green in policy must also grow on the ground.
#”India’s sustainability canvas is filling up with bold strokes of intent. The frameworks are strong, the policies are in motion — but the art remains incomplete. The brush of execution still lags behind the vision.
Anju Sharma
Here’s a quick snapshot of India’s evolving sustainability framework:
YR2000 [🚗] Bharat Stage Emission Norms introduced – India begins regulating vehicle pollution.
YR2001 [⚡] Energy Conservation Act passed – BEE is born.
YR2011 [♻️] ESG enters boardrooms with National Voluntary Guidelines (NVGs).
YR2012 [📊] Top 100 listed firms mandated to report sustainability via BRR.
YR2015 [🏢] BRR expanded to top 500 companies.
YR2016 [🌐] INPPSS launched with UN support.
YR2020 [🌬️] BS-VI norms enforced nationwide — leapfrogging clean air policies.
YR2021 [📃] India backs ISSB — for global ESG alignment.
YR2022 [💱] Carbon Credit Trading legalized.
YR2023 [🛢️] E20 ethanol-blended fuel launched.
[🧾] BRSR Core ESG reporting begins with top 150 companies.
YR2024-Dec
[🏗️] Green Steel classified: <2.2 tCO₂/tonne = Green
[✅] Eco-Mark expanded to 17 product categories
[☀️] Solar PV mandate issued – only Made-in-India cells allowed from June 2026.
What’s Next?
Time to match pace on execution. The clock is green. The momentum must be too.

Originally published on LinkedIn on 2025-03-30 05:39:36: https://www.linkedin.com/feed/update/urn%3Ali%3AgroupPost%3A1967292-7311985426058088448
Greenwashing Deeproots—“When Engines Lie: Hino’s $1.6 Billion Crash into Corporate Deceit” is a bold and striking headline.
When Engines Lie: Hino’s $1.6 Billion Crash into Corporate Deceit
One of the biggest emission frauds in auto history—and the numbers are jaw-dropping.
The US Department_of_#Justice has called it one of the most systemic emission frauds ever recorded. Hino Motors, a Toyota subsidiary, falsified diesel engine emissions data for nearly two decades. Now, the cost of cutting corners has come due.
The_Deception_in_Numbers
19years of falsified emission data (2003–2022)
105,000+ non_compliant engines sold in the U.S.
4.6 million pounds of excess Nitrogen Oxides (NOx) released
Affected: Class 6 & 8 trucks, off_road and industrial vehicles
The Financial Fallout
$521.76 million – CriminalFines
$1.087 billion – Forfeiture penalties
$525 million – Civil settlements across agencies
$1.63 billion total – One of the highest penalties ever in auto emissions fraud
5-year probation – Ban on importing diesel engines into the U.S.
Cost of Redemption
$155 million – For environmental damage mitigation
$144.2 million – For recall & retrofitting of 2017–2019 models
$10+ million – Internal reform budget (audits, compliance tools, training)
Plans to upgrade marine and rail engines to modern standards
Engineers faced extreme internal pressure to meet emissions targets
Whistleblowers silenced or ignored for years
CEO Satoshi Ogiso issued a public apology and admitted to a “broken culture
Japanese regulators revoked certifications of affected Hino models
Industry Shockwaves
20% drop in Hino’s stock in 72 hours
Global recalls ripple across Asia & North America
Toyota’s brand image faces ESG scrutiny
Other Japanese automakers under investigation
Compliance isn’t optional—it’s existential
ESG isn’t a branding tool—it’s a crisis cushion
Culture is strategy when no one’s watching
Originally published on LinkedIn on 2025-03-21 13:54:01: https://www.linkedin.com/feed/update/urn%3Ali%3AgroupPost%3A100646-7308848361606934528
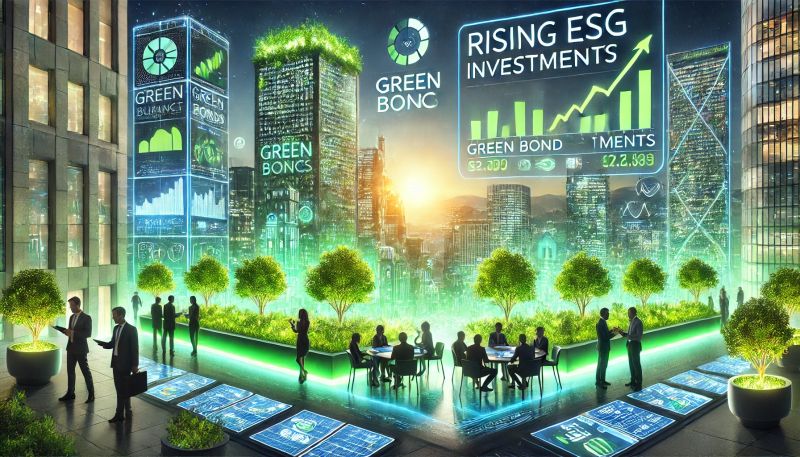
KnowledgeSeries: GreenFinance – The $80 Trillion Opportunity Reshaping Global Capital Markets
🌍 Sustainability = Economics.
💰 GreenFinance is now mainstream, with ESG assets surpassing $50T in 2023, projected to hit $80T by 2030.
🚀 CapitalShiftAlert: Banks, VCs, and InstitutionalInvestors are prioritizing low-carbon businesses. Those who ignore GreenFinance risk obsolescence.
📊 WhyGreenFinance is Taking Over?
✔️ ESGOutperforms: Since 2015, ESG-aligned companies have outperformed markets by 30% (HarvardBusinessReview).
✔️ InvestorShift: ESGFunds saw #$650B inflows in 2023, while traditional funds saw outflows (Morningstar).
✔️ RegulationsTighten: EU & SEC climate disclosure rules mandate carbon reporting, forcing companies to prove sustainability.
✔️ GreenBondsSurge: #$1.5T issued in 2023, funding renewables, transport, and smartcities.
✔️ RiskAndProfitability: Banks raise borrowing costs for polluters, offering low rates to green firms.
🏦 Who’sLeading the GreenFinanceMovement?
✔️ Banks & AssetManagers: BlackRock, GoldmanSachs, JPMorgan—trillions in climate portfolios.
✔️ VentureCapital & PrivateEquity: ClimateTech funding up 210% in 3 years—battery storage, carbon capture.
✔️ SovereignGreenFunds: Norway, Singapore, UAE shifting billions from oil to renewables.
✔️ CorporateGiants: Apple, Microsoft, Tesla issue multi-billion-dollar GreenBonds.
✔️ CarbonMarketsExploding: VoluntaryCarbonMarket set to grow 15X by 2030.
💡 HowBusinessesCanLeverage GreenFinance?
✔️ IssueGreenBonds → Secure low-cost funding for sustainability projects.
✔️ AlignWithESGCriteria → Attract institutional investors & capital.
✔️ TradeCarbonCredits → Monetize emission reductions.
✔️ LeverageImpactInvesting → Tap into VCs, sovereign funds & ESG-focused investors.
✔️ AdoptSmartFinanceTools → Use AI & blockchain for transparent sustainability tracking.
🔍 ComingUpNext: “The Rise of ClimateUnicorns – Where VCs Are Betting in 2025
💬 IsYourBusinessReady for the ClimateEconomy? Let’s discuss!
Originally published on LinkedIn on 2025-03-09 17:24:23: https://www.linkedin.com/feed/update/urn%3Ali%3AgroupPost%3A9500072-7304552646428823552
🚨 India’s Emission Intensity Targets: A Game_Changer for Industries & Carbon#Markets?
India is set to release EmissionIntensityTargets for nine industrial sectors by the end of February 2025—marking a major milestone in its NetZero commitment. With industries given one year to comply, CarbonCreditTrading is expected to follow, reshaping how businesses approach Decarbonization and Sustainability.
📊 What’s Changing?
🔹 Industries Impacted: Steel, Cement, Petrochemicals, Fertilizers, Textiles, Pulp & Paper, Power, and more.
🔹 Compliance Window: Companies get one year to implement emission-cutting measures.
🔹 Carbon Markets Activation: After compliance, CapAndTrade kicks in—firms exceeding targets can sell credits, while high emitters must buy them.
🔹 India’s Net Zero Push: Aims to cut GHG emissions intensity by 45% by 2030 (vs. 2005 levels). (MoEFCC, 2025)
💡 What’s the Opportunity?
✔️ Green Investment Boom: Expect a surge in Renewables, CCUS (Carbon Capture), and EnergyEfficiency projects.
✔️ Competitive Advantage: Early adopters of clean tech & low-carbon solutions will benefit from carbon credits.
✔️ Global Alignment: Brings India closer to EU CBAM, US IRA, & China’s ETS—making exports competitive.
⚠️ The Challenges Ahead
🚨 Cost of Compliance: Industries must invest in LowCarbonTech, Electrification, and AlternativeFuels.
🚨 Regulatory Uncertainty: Clarity on CarbonPricing, OffsetRules, and international trading needed.
🚨 SMEs at Risk: Large firms may comply, but MSMEs could struggle due to financial constraints.
🏆 KeyTakeaway: Green Mandates & Market Forces Converging
📌 India could be a global leader in carbon markets & industrial sustainability.
📌 India should be providing clear policy incentives & transition funds.
📌 India would be missing out if compliance turns into just another Greenwashing exercise.
👉 Will India’s emission trading system be a breakthrough or just another regulatory hurdle? Let’s discuss! 👇
Originally published on LinkedIn on 2025-02-25 17:55:58: https://www.linkedin.com/feed/update/urn%3Ali%3Ashare%3A7300211941875052544
NamasteIndia summary of the roadmap for decarbonization of the steel sector in India:
Background: India’s steel sector contributes approximately 12% of total greenhouse gas emissions.
Emission Intensity: The emission intensity of Indian steel production is 2.55 tonnes of CO2 per tonne of crude steel (higher than the global average).
Roadmap Development: The Ministry of Steel has developed a roadmap for decarbonization.
TaskForces: 14 task forces explored mechanisms for advancing decarbonization.
Integration: Findings from the task forces have been integrated into the roadmap.
Public Consultation: The roadmap will soon be open for public consultation.
Transition Goals: India aims to shift ‘hard-to-abate’ industries from energy efficiency targets to emission targets.
Indian Carbon Market**: Appropriate regulations will be established for the Indian Carbon Market.
This development aligns with sustainability goals and environmental efforts.
Originally published on LinkedIn on 2024-07-28 12:51:40: https://www.linkedin.com/feed/update/urn%3Ali%3AgroupPost%3A2635374-7223309134945804290
NamasteIndia summary of the roadmap for decarbonization of the steel sector in India:
Background: India’s steel sector contributes approximately 12% of total greenhouse gas emissions.
Emission Intensity: The emission intensity of Indian steel production is 2.55 tonnes of CO2 per tonne of crude steel (higher than the global average).
Roadmap Development: The Ministry of Steel has developed a roadmap for decarbonization.
TaskForces: 14 task forces explored mechanisms for advancing decarbonization.
Integration: Findings from the task forces have been integrated into the roadmap.
Public Consultation: The roadmap will soon be open for public consultation.
Transition Goals: India aims to shift ‘hard-to-abate’ industries from energy efficiency targets to emission targets.
Indian Carbon Market**: Appropriate regulations will be established for the Indian Carbon Market.
This development aligns with sustainability goals and environmental efforts.
Originally published on LinkedIn on 2024-07-28 12:51:29: https://www.linkedin.com/feed/update/urn%3Ali%3Ashare%3A7223309090192556032

