Why ESG Isn’t a Global Roadmap—It’s a Country_by_Country_Compass
ESG Isn’t One-Size-Fits-All—It’s One-Strategy-Fits-Nation
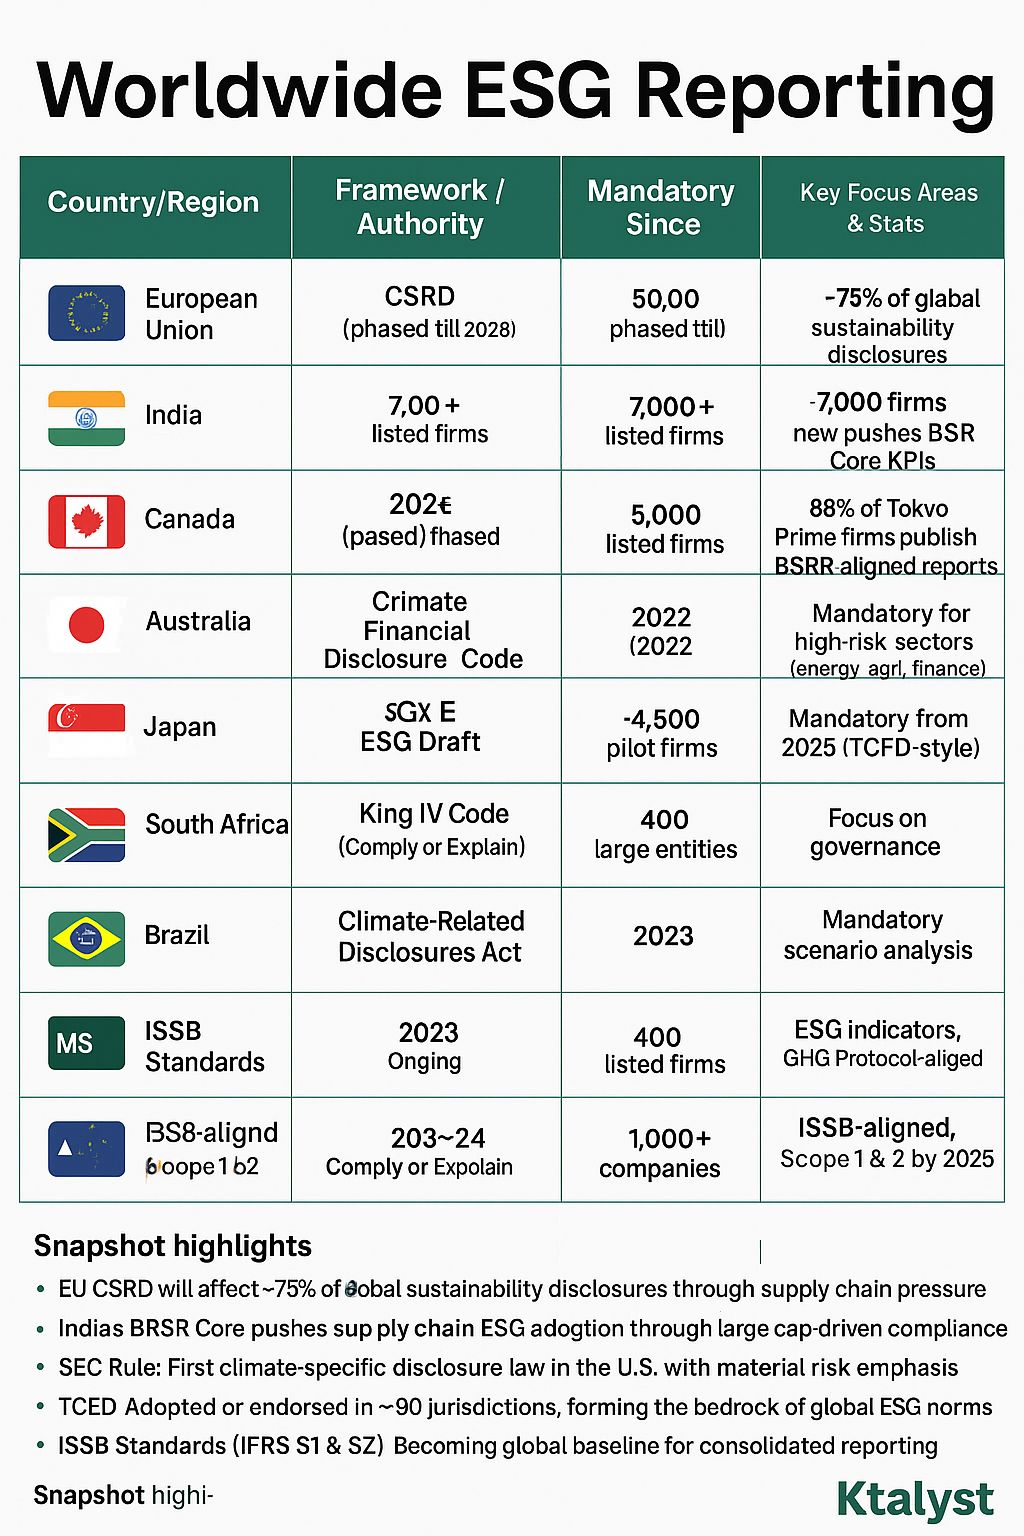
ESG reporting takes different roads because nations prioritize differently—economic maturity, regulatory style, investor pressure, and trade exposure all shape the path. The EU leads with CSRD—affecting 50,000+ firms through double materiality, taxonomy alignment, and mandatory assurance. The US sticks to financial materiality and climate risk, sidestepping Scope 3 and S&G. India’s BRSR ties ESG to development goals, starting with the top 1,000 and easing into assurance. Export-driven China, Malaysia, and Singapore accelerate ESG to meet global buyer expectations and bypass EU CBAM fallout. Japan prefers voluntary codes; South Africa excels in governance (King IV), but lacks integrated data.
Bottom line? ESG mirrors what each country values—growth, governance, global edge, or green capital. It’s not just compliance—it’s strategy, sovereignty, and survival.
🇪🇺 European Union
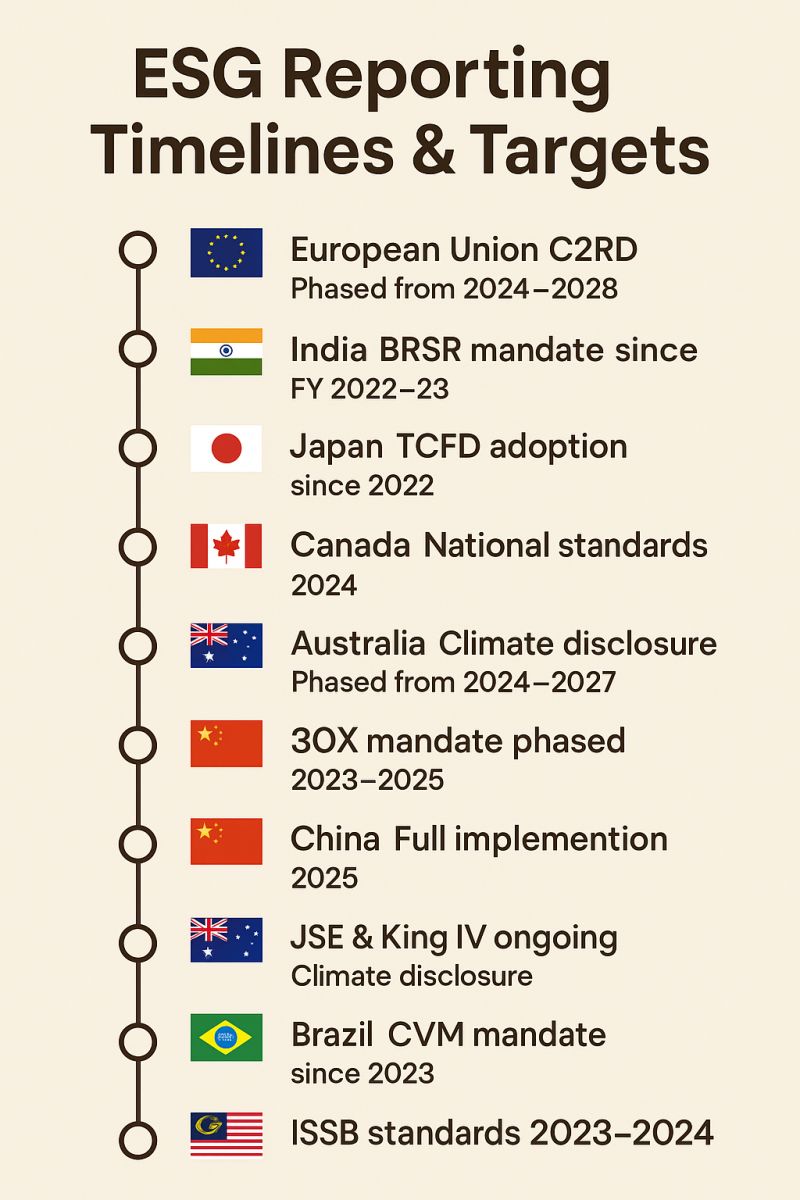
Timeline: CSRD phased from 2024 to 2028
Mandatory from:
2024: Large public-interest companies
2025: All large companies
2026–28: SMEs (limited scope)
FunFact: Will impact 75%+ of global ESG reporting indirectly via supply chains
🇺🇸 United States
Timeline: SEC Rule effective 2024–2025
Mandatory from:
FY2024: Large Accelerated Filers
FY2025: Accelerated Filers
Scope 3? Only if material (and still debated)
🇮🇳 India
Timeline:
BRSR mandatory since FY 2022–23
BRSR Core with limited assurance from FY 2023–24
Next up: Potential rollout for mid-size unlisted companies by 2026
🇯🇵 Japan
Timeline:
TCFD adoption by Prime listed firms since 2022
No fixed law, but >80% of large firms are already onboard voluntarily
🇨🇦 Canada
Timeline:
CSA rule aligned with TCFD from 2024
Mandated for:
Publicly listed entities, expanding coverage gradually
🇦🇺 Australia
Timeline:
Climate Disclosure Framework phased from July 2024
Rollout:
2024: Large companies
2026–27: Mid and small entities
🇸🇬 Singapore
Timeline:
SGX ESG reporting mandatory since 2023
Sector phased:
Energy, Agri, Finance by 2024
All others by 2025
🇨🇳 China
Timeline:
Draft ESG rules under CSRC in 2024
Target:
Full mandatory rollout by 2025
Pilots ongoing in green finance and energy sectors
🇿🇦 SouthAfrica
Timeline:
JSE & King IV apply ongoing since 2016
Mandate:
Comply or explain” model, no fixed year — but tightening expected by 2025
🇳🇿 NewZealand
Timeline:
Climate-Related Disclosure Act enforced from 2023
Applies to:
Financial institutions & large corporates (>NZ$1B AUM or turnover)
🇧🇷 Brazil
Timeline:
CVM ESG disclosure mandatory since 2023
Focus:
Annual reporting, with increasing pressure for Scope 3 inclusion by 2026
🇲🇾 Malaysia
Timeline:
ISSB-aligned standards adopted in 2023–2024
Mandated by:
Bursa Malaysia, full Scope 1–2 by 2025, Scope 3 optional till 2026


Originally published on LinkedIn on 2025-04-21 21:59:46: https://www.linkedin.com/feed/update/urn%3Ali%3AugcPost%3A7320204627323289601
NamasteGreenIndia
Copper Crunch: A Looming Threat to India’s Renewable Energy Ambitions
India’s aggressive push to achieve 500 GW of non_fossil fuel capacity by 2030 hinges on a critical resource: copper. Widely regarded as the “metal of electrification,” copper is vital for renewable energy systems like solar panels, wind turbines, and grid expansion, which require up to five times more copper than traditional power generation methods. However, a domestic supply deficit and growing dependence on imports threaten to derail these plans.
Rising_Demand, Modest_Supply
India is both a significant consumer and a modest producer of copper. Ranked 7th globally in refined copper consumption, India’s demand continues to surge due to its renewable energy and infrastructure ambitions. However, the country ranks 17th in global copper production, contributing a mere 0.2% of the global output. This stark mismatch between consumption and production has led to a heavy reliance on imports, primarily from top copper-producing countries like:
1. Chile – The largest global producer, 28% of the world’s output.
2. Peru – The second-largest producer with 12% of global output.
3. China – A major producer with significant smelting capacity.
4. Democratic Republic of Congo (DRC) – Known for high-grade copper reserves.
5. United States – A leading producer with advanced mining infrastructure.
India’s refined copper imports increased by 30% in FY2023 and by 180% in the first half of FY2024, highlighting its growing dependence on foreign supplies.
Strategic Interventions
To address the copper crunch, India is exploring several strategies:
1. Boosting Domestic Production: The Adani Group’s upcoming smelter with a 0.5 million metric ton capacity is expected to partially bridge the supply gap by FY2025.
2. Promoting Recycling: Copper’s recyclability offers a sustainable solution, but high GST rates on scrap hinder recycling efforts.
3. Exploring Deep-Sea Mining: India plans to explore polymetallic nodules in the Pacific Ocean to secure essential minerals, including copper.
Copper_intensive renewable projects like solar and wind energy are central to India’s climate goals. Solar power installations require 4-5 tons of copper per megawatt, while wind turbines demand 2-3 tons per megawatt. Without a steady copper supply, renewable energy projects could face significant cost escalations and delays, jeopardizing India’s ability to meet its 2030 targets.
With global copper demand projected to double by YR2040, competition for resources is expected to intensify, making a robust and diversified strategy critical for India.
Originally published on LinkedIn on 2024-12-04 14:46:38: https://www.linkedin.com/feed/update/urn%3Ali%3Ashare%3A7270086103792013312
NamasteIndia finds the article The World’s Carbon Emissions from Energy Production” really interesting and checks how India fairs in all.
China is the largest emitter, accounting for almost one-third (31%) of the world’s total carbon dioxide emissions from energy production, with 12.6 billion tonnes.
UnitedStates and India follow, contributing 12.7% and 7.7% of global emissions, respectively.
Despite India’s high total emissions, its per capita emissions are relatively low due to its large population.
Germany is a significant emitter in Europe, with emissions of around 755 million tonnes of CO₂ in 2018. This is roughly double the UK’s emissions for the same year.
Japan is another major emitter, with substantial contributions from its industrial and energy sectors. It is one of the top emitters globally, although specific recent figures were not detailed in the sources.
UnitedKingdom has made significant strides in reducing its carbon emissions, with a total of 380 million tonnes of CO₂ emitted in 2018. The UK’s efforts in transitioning to renewable energy sources have been notable.
AsiaPacific is the highest-emitting region, responsible for 52.1% of global emissions.
NorthAmerica: This region accounts for 15.6% of global emissions. The United States is the largest emitter in North America, contributing 5.1 billion tonnes of CO₂.
Europe: Europe contributes 9.3% of global emissions, with Germany being the highest emitter in the region, producing around 755 million tonnes of CO₂ in 2018.
Commonwealth of Independent States (CIS): This region is responsible for 7.4% of global emissions. Russia is the largest emitter in the CIS, with emissions of 2.2 billion tonnes of CO₂.
Middle East: The Middle East contributes 7.2% of global emissions, with Iran being the highest emitter, producing 937 million tonnes of CO₂.
Africa: Africa accounts for 4.4% of global emissions. South Africa is the largest emitter on the continent, with significant contributions from its coal-based energy sector.
South&Central America: This region is responsible for 4.0% of global emissions. Brazil is the highest emitter in South & Central America, largely due to deforestation and energy production.
These figures highlight the significant impact of fossil fuels on global emissions and underscore the need for a transition to renewable energy sources. Each continent and country faces unique challenges and opportunities in reducing their carbon footprint.
Originally published on LinkedIn on 2024-09-05 19:11:06: https://www.linkedin.com/feed/update/urn%3Ali%3AgroupPost%3A60128-7237537746586636288
NamasteIndia’s Intangible Investment Surge: Paving the Way to a $400 Billion Future by 2030.
Rapid Growth: India has recorded the fastest growth in intangible investments from 2011 to 2020, outpacing major economies like the US, France, Germany, and the UK.
Key Drivers: This growth is fueled by strengths in software and data, new financial products, and increased investment in domestic brands.
Global Position: In 2020, India ranked 14th in absolute levels of intangible investments among 26 advanced economies.
Economic Impact: The significant increase in intangible investments, reaching approximately $200 billion USD in 2020, underscores India’s expanding role in global innovation and intellectual property.
Projections till 2030
Double in Value: Intangible investments could potentially double, reaching around $400 billion USD.
Enhanced Innovation: Continued emphasis on R&D, software development, and brand building will drive further innovation.
Global Leadership: India is poised to strengthen its position as a global leader in intellectual property and innovation.
Source / shared link: https://m.economictimes.com/news/economy/indicators/india-outpaces-major-economies-in-growth-of-intangible-investments/articleshow/112421471.cms
Originally published on LinkedIn on 2024-08-11 02:46:29: https://www.linkedin.com/feed/update/urn%3Ali%3Ashare%3A7228230264081027072

