When_Will_EV_Go_Actually_Green?
Dr. Anju Sharma | KtalystInsights™
Zero tailpipe ≠ Zero carbon. Boards know it. Gen-Z can smell it.
The EV conversation has entered its grown-up phase.
The question is no longer “Is it electric?
It is “Show me the lifecycle math.
1) The headline data (why this matters now)
✓ By 2030, full-lifecycle EV emissions vs ICE fall by:
✓ EU: ~74–77% lower
✓ US: ~62–76% lower
✓ China: ~48–64% lower
✓ India: ~30–56% lower
Hook: The car didn’t change. The grid did.
2) Where the carbon actually sits
✓ Battery manufacturing today emits 60–100 kg CO₂e per kWh
✓ A 60 kWh battery starts life with 3.6–6.0 tonnes CO₂e
✓ Factory electricity source can swing emissions by 3×
Translation:
If Scope-2 is dirty, the EV is just quietly carbon-loaded.
3) Countries winning the EV reality game
✓ Norway: ~96% of new car sales are electric
✓ China: ~48% of passenger car sales already electric
✓ EU: ~17–20% EV share with 2035 ICE exit locked
✓NamasteIndia: 30% EV target by 2030, fastest growth in 2W & 3W
Pattern: Adoption follows grid clarity + policy certainty, not slogans.
4) Companies that actually decide the footprint
✓ BYD: ~2.2M+ BEVs sold; LFP chemistry lowers material risk
✓ Tesla: ~1.6M deliveries; efficiency and software edge
✓ CATL: ~38% global battery install share
Reality: Battery supply chains decide EV greenness more than car badges.
5) What truly changes in 2026–2030
✓ Grid policy becomes EV policy
✓ Cleaner power automatically lowers CO₂ per km
✓ Batteries move from marketing to math
✓ Carbon footprint disclosure, recycled-content mandates, battery passports
✓ Recycling becomes a supply chain
✓ >90% metal recovery technically achievable
✓ Recycled content stabilises cost and ESG credibility
✓ Manufacturing decarbonises or loses access
✓ Grey batteries get priced out by carbon and trade rules
6) Is this a war on crude-rich or climate action?
✓ It’s structural, not emotional
✓ Net oil importers use EVs for energy security
✓ The US treats EVs as an industrial race plus grid economics
Old world ran on barrels.
New world runs on electrons, minerals, and megawatts”. Dr. Anju Sharma
KtalystKlues™
EVs don’t go green when engines disappear.
They go green when battery, grid, and recycling become one auditable system.
KtalystInsights
EVs are now economic infrastructure: lifecycle-clean supply chains drive growth, while greenwashing triggers penalties, capital flight, and lost credibility.
EV EnergyTransition BatteryEconomics GridDecarbonization CircularEconomy Scope2 Scope3 KtalystInsights DrAnjuSharma DataComa
Originally published on LinkedIn on 2026-01-04 05:00:23: https://www.linkedin.com/feed/update/urn%3Ali%3AgroupPost%3A82093-7413444160403283969
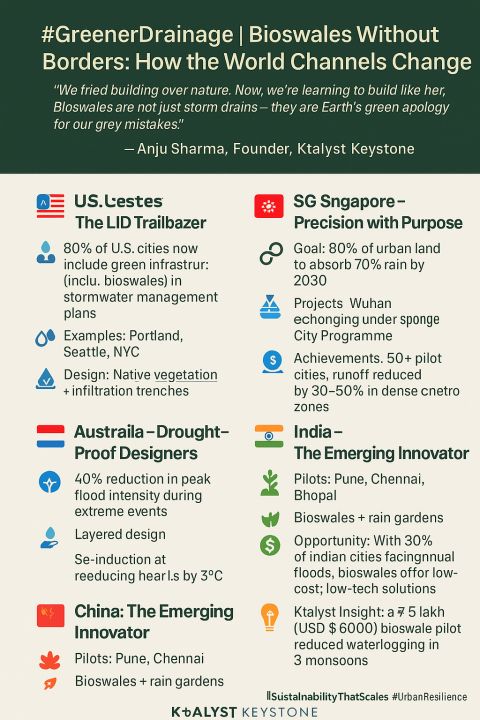
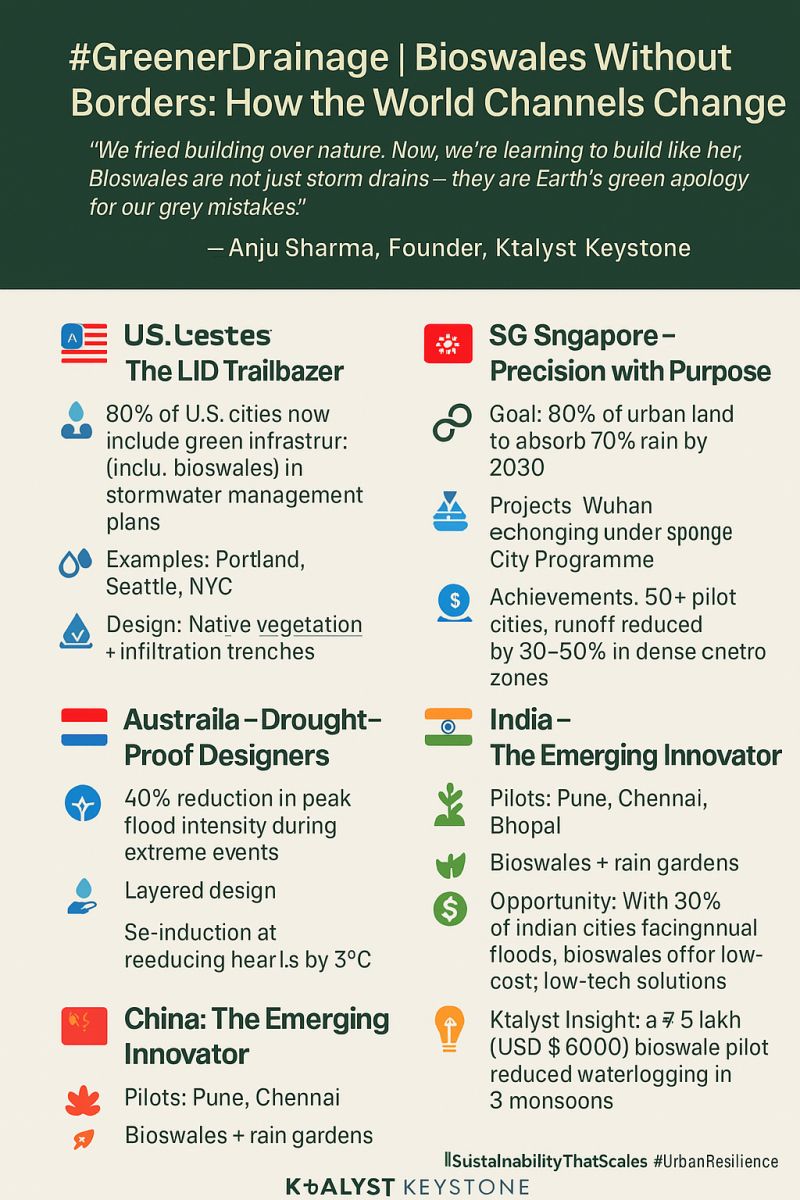
KnowledgeKtalyst GreenerDrainage | Bioswales Without Borders: How the World Channels Change
We tried building over nature. Now, we’re learning to build like her. Bioswales are not just storm drains – they are Earth’s green apology for our grey mistakes.
Anju Sharma | Founder, Ktalyst Keystone
What if stormwater could clean itself before reaching our rivers?
Around the world, bioswales are turning this idea into a reality—naturally filtering water, reducing floods, and beautifying cities while addressing climate resilience.
🌍 Six Countries. Six Styles. One Green Purpose.
🇺🇸 UnitedStates – The LID Trailblazer
🌧️ 80% of U.S. cities now include green infrastructure (incl. bioswales) in stormwater management plans.
🏙️ Examples: Portland, Seattle, NYC
🌿 Design: Native vegetation + infiltration trenches
⚡ Outcome: Up to 90% runoff volume reduction in key pilot zones
🇩🇪🇳🇱 Germany & Netherlands – Bicycle Bioretentionists
🚲 65% of urban roads in Dutch cities use SuDS layouts
🌼 Famous For: Stormwater swales alongside bike highways
📸 Bonus: Used for placemaking and urban branding
🇦🇺 Australia – Drought_Proof Designers
☀️ 40% reduction in peak flood intensity during extreme events (source: Melbourne WSUD case study)
🦘 Cities: Melbourne, Brisbane
🌳 Layered Design: For dry spells and cloudbursts
🔥 Impact: Bioswales integrated into parks, reducing heat islands by 3–5°C
🇸🇬 Singapore – Precision_with_Purpose
💧 ABC Waters Programme launched in 2006
🏝️ Projects: Bishan-AMK Park, Punggol Waterway
🌿 Result: Cleaner waterways + real estate uplift near bioswale zones (up to 12% premium)
🪷 Quote from PUB: “Every drain is now a destination.
🇨🇳 China – The UrbanSponge Model
🏙️ Goal: 80% of urban land to absorb 70% of rain by 2030
🌾 Projects: Wuhan, Chongqing under Sponge City Programme
📉 Achievements: 50+ pilot cities, runoff reduced by 30–50% in dense metro zones
🇮🇳 India – The EmergingInnovator
🇮🇳 Pilots: Pune, Chennai, Bhopal
🌱 Design: Bioswales + rain gardens
💡 Opportunity: With 30% of Indian cities facing annual floods, bioswales offer low-cost, low-tech solutions
🌟 Ktalyst Insight: A ₹5 lakh (USD ~$6,000) bioswale pilot reduced waterlogging in 3 monsoons


Originally published on LinkedIn on 2025-04-09 06:51:09: https://www.linkedin.com/feed/update/urn%3Ali%3AgroupPost%3A82951-7315627313553981440
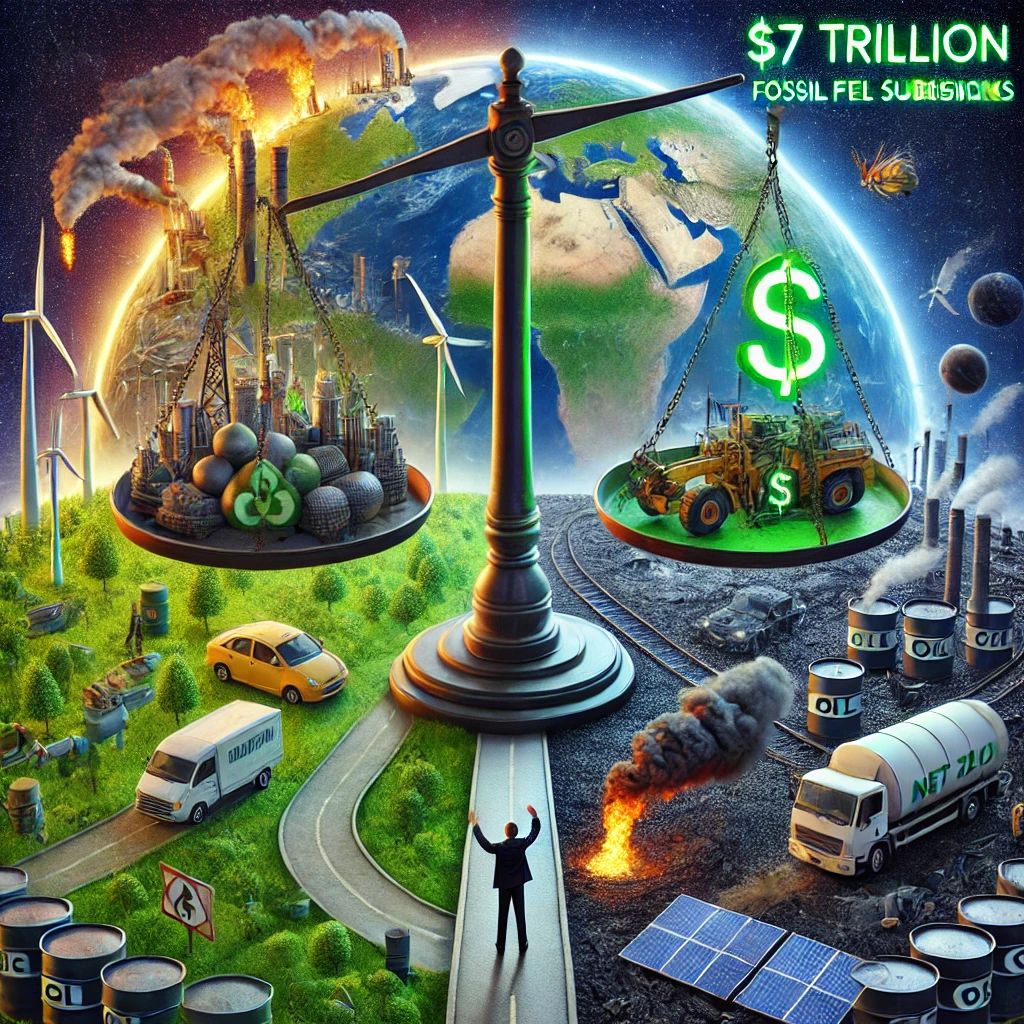
🚨 “The USD_7 Trillion Green Paradox: Saving the Planet or Fueling the Crisis?” 🌍♻️💰
📊 1. The Green Investment Paradox: More Money, More Emissions
✅ #$1.7 trillion invested in clean energy in 2023 (IEA, 2024)
❌ #$7 trillion in fossil fuel subsidies were paid out in 2023 (IMF, 2024)
✅ 120+ countries pledged net-zero targets
❌ Only 20% have actual policies & execution plans (Net Zero Tracker, 2024)
❌ CO₂ emissions hit a record high of 37.5 billion tons in 2023 (Global Carbon Budget, 2024)
🚨 Reality Check: For every $1 spent on green energy, $4 still funds fossil fuels.
🇩🇰 Denmark: 75% renewables, carbon-neutral by 2045 (EPI, 2024)
🇸🇪 Sweden: 98% recycling rate, world leader in circular economy (WEF, 2024)
🇳🇴 Norway: 80% of new car sales are EVs, hydro-powered energy (IEA, 2024)
🇪🇺 EU: #€1 trillion Green Deal investment, strict carbon pricing (EU Commission, 2024)
🚨 Reality Check: Even the greenest nations rely on imported fossil fuels & high energy consumption.
🟡 3. The Green Economy Paradox: Investing While Polluting
🇨🇳 China: World’s largest renewable energy investor, but 55% of power still comes from coal.
🇮🇳 India: Fastest-growing solar market, but remains the third-largest CO₂ emitter. (MNRE, 2024)
🇺🇸 USA: #$369B Inflation Reduction Act to fund green tech, but oil production reached a record 13.1M barrels/day in 2023. (DOE, 2024)
🚨 Reality Check: Countries are investing in renewables but not cutting fossil fuel use fast enough.
🔴 4. The Worst Green Offenders: Promises Without Action
❌ 🇦🇺 Australia: The world’s second-largest coal exporter, despite ‘green economy’ branding. (Climate Council, 2024)
❌ 🇷🇺 Russia: No net-zero plan, fossil fuel revenue = 40% of its economy. (UNEP, 2024)
❌ 🇸🇦 Saudi Arabia: Announced $260B for renewables but still earns 90% of its GDP from oil. (IEA, 2024)
🚨 Reality Check: Without emission cuts, green projects don’t fix the problem.
📉 5. The Harsh Truth: Emissions Are Still Rising
❌ 2023 was the hottest year ever recorded, with global temperatures 1.48°C above pre-industrial levels. (NASA, 2024)
❌ Carbon capture tech only offsets 0.1% of annual global emissions. (IPCC, 2024)
❌ At current transition rates, the world will miss its 1.5°C climate target by 2040. (UNEP, 2024)
🚨 Reality Check: We must cut global emissions 43% by 2030 to stay on track—but we’re nowhere close.
🏆 KeyTakeaway
The Green Economy paradox is real—we invest in sustainability while financing fossil fuels even more. Until green investments outpace fossil fuel spending, and emissions actually drop, we’re not in a real transition.
Originally published on LinkedIn on 2025-02-03 04:11:43: https://www.linkedin.com/feed/update/urn%3Ali%3AgroupPost%3A82951-7292031979921797120
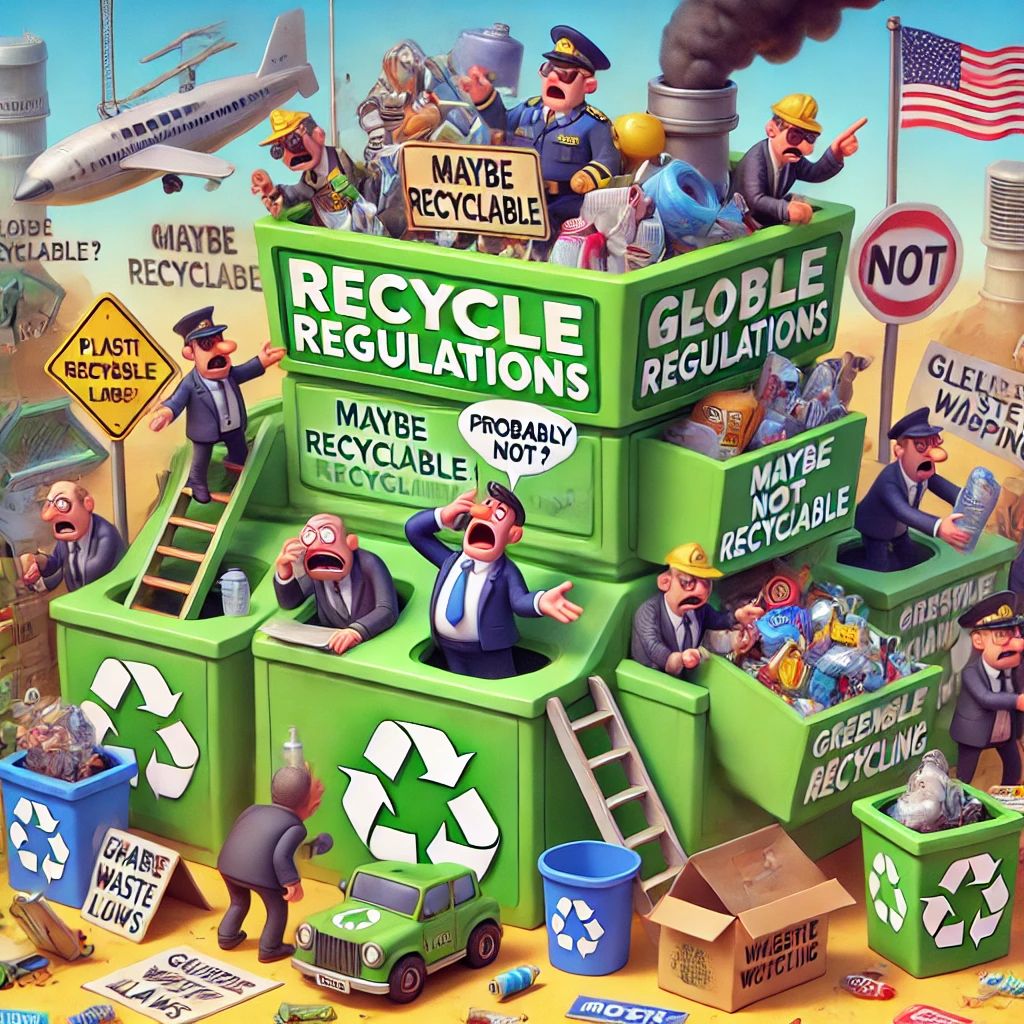
Recycle_Regulations: The New Gold Standard or a Global Mess?” ♻️🌍📜
Recycling isn’t just about throwing plastic into the right bin—it’s becoming a highly regulated industry with economic, environmental, and political implications. But are these recycle_regulations actually working, or are they just creating bureaucratic_chaos? Let’s break it down data-first.
📜 1. The Global Recycling Rulebook is Expanding
✅ Over 190 countries signed the Basel Convention, restricting plastic waste exports. (Source: UN, 2023)
✅ EU’s Circular Economy Package mandates 65% recycling targets by 2035. (Source: EU Commission, 2024)
✅ US States Are Taking the Lead: California’s SB 54 law requires 30% of plastic to be recyclable by 2028. (Source: CalRecycle, 2024)
🚨 The Problem? Many rules lack enforcement, and illegal waste dumping is still a #$10 billion global industry. (Source: Interpol, 2023)
⚖️ 2. Who’s Paying? The Battle Over EPR (Extended Producer Responsibility)
✅ Canada, EU & Japan require companies to fund recycling programs through EPR laws.
✅ India’s EPR Rules now hold businesses responsible for plastic recovery quotas. (Source: CPCB, 2024)
🚨 The Problem? Many companies shift costs to consumers, raising product prices.
🏆 Winner: Governments with strict accountability like Germany & South Korea.
❌ Loser: Developing nations drowning in imported plastic waste.
🛑 3. Greenwashing vs. Real Impact
✅ France bans ‘Recyclable’ labels unless companies prove 100% recyclability. (Source: French Gov, 2024)
✅ EU’s new Digital Product Passport tracks materials from production to disposal. (Source: EU Commission, 2024)
🚨 The Problem? 60% of ‘recyclable’ plastic isn’t actually recycled due to lack of infrastructure. (Source: Greenpeace, 2023)
🏆 Winner: Countries mandating transparency & product lifecycle tracking.
❌ Loser: Brands using misleading recycling claims.
🏗️ 4. The Future of Recycling Laws
📈 AI & Robotics to improve sorting efficiency & reduce contamination.
♻️ Chemical Recycling is gaining traction but faces cost & emissions concerns.
🚀 Global Agreements like the UN Plastics Treaty (2025) could reshape waste management worldwide.
🏆 Final Verdict: Recycling regulations are evolving, but enforcement is the real battle.
🏆 KeyTakeaway
Recycling isn’t just about being green—it’s about accountability. The future will belong to nations & businesses that get it right while others struggle with waste crises & regulatory chaos.
👉 Is your country leading or lagging in the recycling revolution?
RecycleRegulations CircularEconomy GreenLaws Sustainability PlasticCrisis NetZero
Originally published on LinkedIn on 2025-01-30 18:34:51: https://www.linkedin.com/feed/update/urn%3Ali%3AgroupPost%3A100646-7290799643045646336
NamasteIndia just ahead of the COP29 Global GHG Emissions by Sector and Key Countries (2023)
Sector Breakdown
1. Power (26%, 15 Gt)
China (27%), US (11%), India (7%): Coal dominates emissions.
Focus: Transition to renewables and improve grid efficiency.
2. Transport (15%, 9 Gt)
US, China, EU: High emissions from vehicles and freight.
Focus: Expand EV adoption and public transport.
3. Industry (11%, 6 Gt)
China, India, US: Cement, steel, and chemical production.
Focus: Decarbonize processes with clean technology.
4. Fuel Production (10%, 6 Gt)
Russia, Middle East, US: Fossil fuel extraction.
Focus: Reduce methane leaks and shift to alternatives.
5. Agriculture (11%, 6 Gt)
Brazil, India, US: Methane from livestock, rice cultivation, and fertilizer.
Focus: Promote regenerative farming and reduce food waste.
6. Land Use & Forestry (7%, 4 Gt)
Brazil, Indonesia, Africa: Deforestation and land conversion.
Focus: Reforestation and sustainable land management.
7. Buildings (6%, 3 Gt)
US, China, EU: Energy use for heating and construction.
Focus: Energy-efficient buildings and renewable energy.
8. Waste (4%, 2 Gt)
India, China, US: Methane from landfills and wastewater.
Focus: Modernize waste management and capture methane.
Top Emitters
China (~30%): Coal, cement, and steel dominate.
US (~14%): Transport and energy-intensive sectors.
India (~7%): Power and agriculture emissions.
EU (~8%): Heavy industries and aging systems.
Brazil & Indonesia: Deforestation hotspots.
Global Priorities:
Energy: Expand renewables and phase out coal.
Transport: Scale up EVs and public transit.
Industry: Invest in clean production technologies.
Forestry: Halt deforestation and restore ecosystems.
Impact: Tailored, sector-specific strategies can drive significant reductions in global GHG emissions.
Source / shared link: https://www.visualcapitalist.com/charted-global-ghg-emissions-by-sector/
Originally published on LinkedIn on 2024-11-19 03:28:20: https://www.linkedin.com/feed/update/urn%3Ali%3AgroupPost%3A59930-7264479581858861056
NamasteIndia…..“Howdy, Modi!” “Namaste Trump
Sisterhood Between Countries and Bromance Between Leaders: How India_US Relations Will Develop with Trump Returning to the White House?
With DonaldTrump now elected as the 47th President of the UnitedStates, he has expressed admiration for India and Prime Minister Narendra Modi, calling them both “magnificent.” This personal rapport between the leaders, combined with the strategic alignment of the two countries, lays the groundwork for a promising yet complex relationship. Here’s a look at how this “sisterhood” between the nations and “bromance” between the leaders might shape the future of India-US relations.
Strengthening Defense and Security Ties
Trump’s previous tenure saw him focus on defense partnerships with India, including arms sales and joint military exercises.
As a Major Defense Partner, India’s role in the Indo-Pacific is likely to grow, with Trump aiming to deepen these ties as a counterbalance to regional threats.
Trade Relations: Balancing Act
Trade was contentious under Trump, with tariffs on Indian goods and the revocation of India’s preferential trade status.
Both nations may aim to negotiate a balanced trade agreement that addresses these past disputes while fostering economic growth.
Immigration Policies and Skilled Workforce
Trump’s administration previously implemented stricter immigration policies, impacting Indian professionals in the tech sector.
While prioritizing American jobs will likely continue, there may also be an effort to balance this with India’s significance in the global tech landscape.
Strategic Cooperation in the Indo-Pacific
The Trump administration emphasized India’s role in the Indo-Pacific, including through collaborations like the Quadrilateral Security Dialogue (Quad).
As China’s influence grows, Trump is expected to promote India as a crucial ally, advocating for a free and open Indo-Pacific region.
Personal_Diplomacy and Public Engagement
The “bromance” between Trump and Modi was highlighted in events like “Howdy, Modi!” in Houston and “Namaste Trump” in Ahmedabad, which showcased their strong rapport.
This personal connection is expected to continue, with high-profile events likely reinforcing the symbolic and substantive strength of the India-US partnership.
In summary, Trump’s return to the White House signals both opportunities and challenges for India-US relations. While defense and strategic cooperation are set to deepen, issues like trade and immigration may require nuanced negotiations. With the “sisterhood” between the countries and the “bromance” between Trump and Modi, this critical partnership is well-positioned to evolve and adapt in a shifting global landscape.
Source / shared link: https://www.hindustantimes.com/india-news/pm-modi-dials-up-trump-says-looking-forward-to-work-together-again-101730912539575-amp.html
Originally published on LinkedIn on 2024-11-08 02:44:28: https://www.linkedin.com/feed/update/urn%3Ali%3Ashare%3A7260482279607558144
Global Leaders in Ethanol Blending in Fuel: India’s Role and Achievements
NamasteIndia ranks among the top ethanol producers globally, alongside the US and Brazil. Tops Countries
1. US: The largest producer and consumer of ethanol, Production: 876K barrels Consumption 838K barrels per day.
2. Brazil: Produces 403K barrels per day and consumes 359K barrels per day.
3. China: Produces and consumes 43K barrels per day.
4. Canada: Produces 33K barrels per day; consumes 41K barrels per day.
5. France: Produces 17K barrels per day & consumes 13 thousand barrels per day.
6. Germany: Produces 13K barrels per day and consumes 27K barrels per day.
7. Colombia: 8.5K barrels/day (produces), 6.1K barrels/day (consumes).
8. Thailand: 8.1K barrels/day (produces), 9.1K barrels/day (consumes).
9. Guatemala: 8K barrels/day (produces).
10. Spain: 7.9K barrels/day (produces), 8K barrels/day (consumes).
11. Belgium: 6.8K barrels/day (produces), 1.8K barrels/day (consumes).
12. India: 5.3K barrels/day (produces & consumes).
13. Australia: 5.3K barrels/day (produces), 5.1K barrels/day (consumes).
14. UK: Produces 4.3 thousand barrels per day and consumes 17 thousand barrels per day.
India’s Ethanol Blending in Gasoline Industry
Key_Facts_&_Figures
Ethanol Blending Target: India aims to achieve 20% ethanol blending in gasoline by 2025, a goal accelerated from the original target of 2030.
Current Blending Level: As of May 2024, India has achieved a 15% ethanol blending rate.
Economic Impact: A successful ethanol blending program can save India approximately $4 billion (₹30K crore) annually by reducing oil imports.
Production Volume: India plans to produce around 10 billion liters (1,000 crore liters) of ethanol to meet the 20% blending target.
Role of Key Stakeholders
Government:
Policy Framework: The government has implemented policies like the National Policy on Biofuels.
Pricing and Incentives: The government administers ethanol prices and provides incentives to encourage production and blending.
Oil Marketing Companies (OMCs):
Procurement: OMCs issue annual tenders to procure ethanol from producers.
Blending and Distribution: OMCs blend ethanol with gasoline at designated depots and distribute the blended fuel to retail stations.
Sugar Industry:
Production: The sugar industry is a major producer of ethanol, utilizing by-products like molasses. Leading companies include Bajaj Hindusthan Sugar Ltd., Balrampur Chini Mills Ltd., Shree Renuka Sugars Ltd., and Dhampur Sugar Mills Ltd., contributing significantly to the total ethanol production.
Environmental impact: supports bioenergy production and waste utilization but also faces challenges like high water usage and pollution.
Originally published on LinkedIn on 2024-09-25 05:31:06: https://www.linkedin.com/feed/update/urn%3Ali%3AgroupPost%3A60128-7244579146016641026
NamasteIndia gets you some interesting facts:
Top5 IndianStates vrs. Top5 global companies Electricity usage:
Maharashtra: Google (~180 TWh)
UttarPradesh: Microsoft (~120 TWh)
TamilNadu: Amazon (~110 TWh)
Gujarat: Apple (~100 TWh)
Karnataka: Meta (Facebook) (~90 TWh)
Top5 Countries by Electricity Consumption
China: Over 8,000 TWh in 20223.
UnitedStates: Over 4,000 TWh in 20223.
India: Around 1,443 TWh in 20214.
Russia: Approximately 996 TWh in 20214.
Japan: Around 913 TWh in 2021
Top5 Indian companies their equalent states for using electricity in India:
Reliance Industries Limited (RIL): Goa (~1.5 GW)
Tata Steel: Sikkim (~1.2 GW)
Adani Group: Mizoram (~1.1 GW)
NTPC Limited: Nagaland (~1 GW)
SteelAuthority of India Limited (SAIL):Arunachal Pradesh (~0.9 GW)
Top 5
Charted: Big Tech Uses More Electricity Than Entire Countries https://lnkd.in/dc-jDN2B
Originally published on LinkedIn on 2024-08-18 15:58:29: https://www.linkedin.com/feed/update/urn%3Ali%3Ashare%3A7230966294903197697
NamasteInvestInsia
The total FDI — which includes equity inflows, reinvested earnings and other capital — equity inflows into India fell to $44.42 billion in 2023-24, a 3.49% decrease from $46.03 billion in the previous year.
Overall FDI decreased by 1% to $70.95 billion from $71.35 billion.
Here are the Top 10 countries that have invested in India in FY24
Singapore: $11.77 billion
Mauritius: $7.97 billion
USA: $4.99 billion
Netherlands: $4.93 billion
Japan: $3.17 billion
UAE: $2.9 billion
UK: $1.2 billion
Cyprus: $806 million
Germany: $505 million
Cayman Islands: $342 million
(Source: Statista, Release Date: May 2024, Survey Time Period: FY2024)
Originally published on LinkedIn on 2024-07-28 15:01:15: https://www.linkedin.com/feed/update/urn%3Ali%3AgroupPost%3A2474261-7223341743667073024
NamasteInvestInsia
The total FDI — which includes equity inflows, reinvested earnings and other capital — equity inflows into India fell to $44.42 billion in 2023-24, a 3.49% decrease from $46.03 billion in the previous year.
Overall FDI decreased by 1% to $70.95 billion from $71.35 billion.
Here are the Top 10 countries that have invested in India in FY24
Singapore: $11.77 billion
Mauritius: $7.97 billion
USA: $4.99 billion
Netherlands: $4.93 billion
Japan: $3.17 billion
UAE: $2.9 billion
UK: $1.2 billion
Cyprus: $806 million
Germany: $505 million
Cayman Islands: $342 million
(Source: Statista, Release Date: May 2024, Survey Time Period: FY2024)
https://lnkd.in/d5vipzcP
Originally published on LinkedIn on 2024-07-28 15:01:04: https://www.linkedin.com/feed/update/urn%3Ali%3Ashare%3A7223341701552082946

