SynapticShift: Chemical Capital Is Moving Toward Defensible Margins
Chemical restructuring is no longer an operating-cost story.
It is a capital-allocation reset.
Europe has already seen 37 Mt of chemical capacity close since 2022 around 9% of production capacity with 20,000 direct jobs lost and 89,000 indirect jobs at risk.
Utilisation tells the same story.
EU27 chemical capacity utilisation fell to 74.6% in Q3 2025, against an 81.3% long-run average.
Trade is weakening too.
The EU chemicals trade surplus dropped from €24.4 bn to €20.1 bn in H1 2025.
The sharper signal is capex.
Confirmed new-capacity capex collapsed from €7.6 bn to €1.5 bn between 2022 and 2025 YTD.
This is not an exit from chemicals.
It is an exit from uncompetitive chemistry.
Capital is moving toward:
→ North America: ethane and feedstock advantage
→ China: world-scale Verbund and integration
→ Middle East: crude-to-chemicals economics
→ Circular platforms: recycling, SAF, bio-based and low-carbon chemistry
The new financial map is not drawn by capacity.
It is drawn by margin custody — feedstock, energy, carbon, chemistry and ROIC resilience.
The winning question is no longer:
How much capacity do you own?
It is:
How much of that capacity can still defend margin?
Originally published on LinkedIn on 2026-06-15 10:46:15: https://www.linkedin.com/feed/update/urn%3Ali%3AgroupPost%3A1910576-7472238034919419905
KtalystKlues™ | SynapticShift: ChemicalCapital Is Moving Toward Defensible Margins
The chemical industry is not entering a normal downcycle.
It is entering a capital-rating cycle.
Plants are no longer being judged only by nameplate capacity, technology age or historic strategic importance.
They are being judged by a sharper question:
Can this asset defend margin under energy, carbon, utilisation and trade pressure?
Europe is the clearest stress test.
Cefic’s 2022–2025 closure radar shows European chemical closures reaching 37 Mt of capacity — around 9% of European production capacity — with nearly 20,000 direct jobs affected. This is not maintenance. This is industrial restructuring.
The utilisation signal is equally uncomfortable. Cefic’s 2025 Facts & Figures notes that European chemical capacity utilisation remains 9.5% below pre-crisis levels, while weak demand and import pressure continue to weigh on the system.
Energy is the valuation divider.
IEA data shows EU electricity prices for energy-intensive industries in 2025 were still more than 2x US levels and nearly 50% above China. Cefic also flags European gas prices at around 3x US levels.
The trade balance is also changing character.
Europe still has specialty strength, but Cefic says Europe’s global chemical market share has fallen to 13%, while China now accounts for 46% of global chemical sales. In 2025, the EU27 chemicals trade surplus was €7.3 bn below 2024, with deficit already visible in volume terms.
Capital markets are reading the same signal.
McKinsey’s 2026 chemicals outlook says the sector has entered structural underperformance, after three years of reduced demand and intensifying competition reshaped market dynamics.
Company actions now look less like isolated restructuring and more like a new direction of capitalism.
Dow is shutting higher-cost upstream European assets to improve profitable derivative demand and margin optimisation.
BASF is progressing its China Zhanjiang Verbund core and a $1 bn MDI expansion in Geismar, while planning lower capex intensity after its peak investment phase.
The message is clear.
Chemical capital is no longer rewarding volume for volume’s sake.
It is moving toward:
→ advantaged feedstock
→ lower energy exposure
→ integrated value chains
→ higher utilisation resilience
→ stronger regional demand pull
→ assets that can survive carbon, cost and trade repricing
This is not the end of European chemistry.
But it is the end of assuming that every legacy molecule deserves fresh capital.
The new chemical capitalism is not asking:
Where is capacity?
It is asking:
Where is defensible margin?
And that question is now rewriting the global chemical footprint.
Dr. Anju Sharma
MrsSustainability | Ktalyst Keystone
KtalystKlues Chemicals CapitalMarkets IndustrialStrategy Sustainability
Originally published on LinkedIn on 2026-06-15 09:57:11: https://www.linkedin.com/feed/update/urn%3Ali%3AugcPost%3A7472225689920909313
AI_ProfitPool LeavingScreens
Dr. Anju Sharma MrsSustainability
AI started as a software story, now it’s morphing to an hardware high cycle.
Wave1 was public fascination: models, copilots, agents, apps & chatbots.
Wave2 is less glamorous, more capital-intensive & far more strategic.
It sits behind the screen:
Data centres. Chips. Power systems. Cooling loops. Grid access. Specialty chemicals. Water systems. Transformers. Storage. Carbon accounting.
Ktalyst5Cs™ Lens translates a signal map for tracking where capital, capability, constraint & profit are moving in the AI economy:
Compute → Capex → Chemicals → Climate → Clean Growth
The data spine is already visible.
The IEA projects global data-centre electricity consumption could double to around 945 TWh by 2030, growing nearly 15% annually.
Reuters has reported Big Tech AI spending moving toward the US$600 billion range, shifting investor focus from AI excitement to capex productivity, cash-flow discipline & return visibility.
BloombergNEF estimates data-centre investment could reach US$3.3 trillion through 2029, with global data-centre demand already exceeding 84 GW.
Who captures the industrial profit pool that makes the model scalable?
Compute becomes the first scarcity gate.
GPU makers, advanced memory players, foundries, hyperscalers & AI accelerator suppliers sit closest to the first monetisation layer.
Data centres become the new industrial real estate.
Colocation players, REITs, EPC firms, modular infrastructure builders & hyperscalers gain as digital growth turns into land, shells, racks, cables, cooling & grid connections.
Power becomes the strategic moat.
Utilities, transformer makers, grid-equipment suppliers, storage providers, microgrid developers & backup-power companies move from support layer to core value chain.
Cooling becomes uptime insurance.
Immersion cooling, HVAC, chiller systems, heat-transfer fluids, water-treatment chemistry & recycling technologies become essential as AI servers generate concentrated heat.
Chemicals become the hidden material spine.
This may be the most underpriced profit pool.
AI infrastructure needs semiconductor chemicals, photoresists, etchants, CMP slurries, specialty gases, dielectric cooling fluids, flame-retardant polymers, cable insulation, transformer oils, coatings, adhesives, encapsulants & water-treatment chemistry.
The next petrochemical growth story may not be parked in a showroom.
It may be humming inside a data centre.
Clean energy becomes capacity credibility.
Renewables, storage, clean firm power, heat recovery, microgrids & energy-management systems gain as AI infrastructure faces pressure to prove reliability & climate legitimacy.
KtalystKlues™:
✓Compute captures demand.
✓Capex builds capacity.
✓Chemicals enable reliability.
✓Climate defines permission.
✓Clean Growth protects legitimacy.
Ktalyst5Cs™ KtalystKlues™ KtalystInsights™ KtalystKeystone ChemicalIndustry Petrochemicals
Originally published on LinkedIn on 2026-06-08 11:21:20: https://www.linkedin.com/feed/update/urn%3Ali%3AgroupPost%3A1910576-7469710148266106880
NamasteIndia 🇮🇳🤝🇪🇺 TariffThermostat.
Dr. Anju Sharma | MrsSustainability | KtalystInsights™
Think of this deal like a smart grid:
Not one big ON/OFF switch but calibrated settings (quotas, phase-downs, rules-of-origin) that decide who gets stable flow… and who trips the breaker.
TheNumbers
✅ >90% of EU goods exports: tariffs eliminated / reduced
✅ €4B/year duty savings (EU estimate)
✅ EU exports to India already support ~800,000 EU jobs
✅ EU expects exports to India to double (ambition stated)
Where the “tariff cliff” drops
⚙️ Machinery: up to 44% → ~0% (almost all)
🧪 Chemicals: up to 22% → ~0% (almost all)
💊 Pharma: 11% → ~0% (almost all)
🩺 Medical/optical: up to 27.5% → 0% (90% items)
Automotive
🚗 Cars: 110% → 10% (phased)
🎟️ Quota: 250,000 vehicles/year
Translation: this is not a floodgate — it’s a metered pipeline.
Agri-food: the “lifestyle tariff reset
🍷 Wine: 150% → 20–30%
🥃 Spirits: up to 150% → 40%
🍺 Beer: 110% → 50%
🥫 Processed foods: up to 50% → 0% (many lines)
Compliance architecture.
✅ Rules of Origin = “passport control for products
If value-add isn’t proven, preference is denied.
✅ Sustainability isn’t a brochure page: commitments on labour + environment + women’s empowerment are framed as binding + enforceable (via consultation mechanism).
✅ Digital + IP + Dispute settlement = the operating system that makes trade predictable.
Reality check (before the victory lap)
This is negotiated… not yet operational.
EU still lists 7 steps before entry into force: publish texts → legal scrub/translation → Council proposal/adoption → signature → Parliament consent → Council conclusion → then India ratification.
KtalystLens
If tariffs are the price, then proof is the new currency.
The winners won’t be the lowest-cost manufacturers.
They’ll be the firms with the cleanest documentation + traceability + audit stamina.
Originally published on LinkedIn on 2026-01-29 06:36:14: https://www.linkedin.com/feed/update/urn%3Ali%3AugcPost%3A7422527981144723456
TheChemical_Industry generated ~USD57billion in net profits and invested ~USD73billion in CAPEX in YR2024, yet TSR remains structurally weak. WHY?
Dr. Anju Sharma
KtalystInsights™ MrsSustainability
KtalystKlues
This is not a DemandParadox; it is a ValueCapture problem.
1) The industry is still profitable
✓ Global Top-50 chemical companies reported #~USD57billion net profit in 2024
✓ Average sector EBITDA margins ~12–15% for large integrated players
✓ A majority of listed chemical companies remained cash-positive despite margin pressure
KtalystInsights:
Profitability exists; this is not a demand-led downturn.
2) Capital investment has not stopped
✓ Global chemical CAPEX in 2024: ~USD73billion (Top-50 companies)
✓ R&D spend grew ~2–4% YoY in 2024 despite earnings pressure
KtalystInsights:
Industries facing structural demand decline do not sustain this level of investment.
3) Volumes are growing faster than pricing
✓ Global chemical market size grew from #~USD6.18trillion (2024) to #~USD6.32trillion (2025E)
✓ Packaging, electronics, mobility & construction chemicals showed #~1.5–3% volume growth
✓ Real pricing power across bulk and semi-specialty chains remained flat to negative
KtalystInsights:
Demand growth exists, but value per unit has diluted.
4) TSR is weak because capital intensity has risen
✓ Chemical sector 5-year TSR ~2–3% p.a. vs #~8–9% for MSCI World
✓ Average CAPEX-to-sales ratio increased ~150–250 bps vs pre-2015 levels
✓ Energy transition and ESG CAPEX raised fixed costs without near-term pricing upside
KtalystInsights:
Returns compress when each dollar of profit requires more capital.
5) Overcapacity is real—but uneven
✓ China accounted for #~40%+ of global new petrochemical capacity additions (2019–2024)
✓ Utilisation in multiple commodity chains remains #~70–80%, below mid-cycle norms
✓ Specialty chemicals show #~40–50% lower EBITDA volatility vs commodity chemicals
KtalystInsights:
McKinsey’s conclusion fits commodity and aging specialty chains, not the entire sector.
6) Segment data shows divergence, not uniform decline
✓ Regulation-linked chemicals often sustain ROIC in the high-teens to low-20% range
✓ Application-embedded specialties outperform sector TSR by ~300–500 bps
✓ Commodity chemicals trend at or near cost of capital
KtalystInsights:
The issue is business-model selectivity, not sector weakness.
7) What McKinsey measures vs what boards must decide
✓ McKinsey evaluates relative investor returns (TSR)
✓ Boards must manage absolute cash generation and capital efficiency
✓ Demographics support demand; strategy decides economic rent
KtalystInsights:
Chemicals are essential—but not all are equally rewarded.
> This is not a low-demand cycle.
It is a high-capital, low-pricing-power environment.
Dr. Anju Sharma
KtalystInsights™ MrsSustainability Chemicals Strategy ValueCapture TSR BoardroomLens DataComa
Originally published on LinkedIn on 2025-12-28 10:35:57: https://www.linkedin.com/feed/update/urn%3Ali%3Ashare%3A7410991894211543040
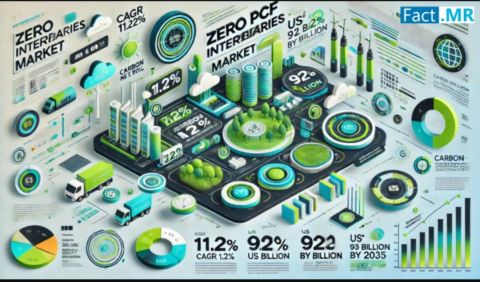
KnowledgeSeries: ZeroPCF Intermediaries – The Future of SustainableIndustry
🔍 WhatAreZeroPCFIntermediaries?
✔ LowCarbon materials reducing Scope3Emissions
✔ 76% of companies committed to NetZero by 2030
📌 KeySectorsBenefiting:
🏭 Manufacturing – 32% emissions cut using LowCarbonMetals
⚕ Pharma – 28% of APIs now sourced from SustainableFeedstocks
♻ Chemicals – 41% surge in BiobasedAlternatives demand
🛢 Energy – GreenHydrogen market to grow $500B by 2050
💰 GreenFinance & CarbonPricing:
✔ $1.2T+ in ClimateFinance by 2025
✔ CarbonMarkets to grow 5X by 2030
✔ 68% of ESGFunds prioritize ZeroPCFAdopters
📜 RegulatoryPush:
✔ CBAM (Carbon Border Adjustment Mechanism) – 20% tariff hike on HighCarbonImports
✔ NetZeroMandates – 1500+ firms now LegallyBound to cut emissions
✔ GovIncentives – 40+ countries offer tax benefits for ZeroPCFManufacturing
🚧 Challenges:
⚠ CostFactor – 27% higher initial investment
⚠ SupplyChainAdaptation – 60% of suppliers lack PCFcertification
⚠ VerificationComplexity – 48% struggle with CarbonTracking
📈 TheFuture:
🌱 AIDrivenCarbonTracking – 80% adoption in SupplyChains by 2030
🚀 GreenMaterialsMarket projected at $600B by 2035
📊 InvestorFocus – Companies with LowCarbonFootprint see 35% valuation premium
👉 ActionPoint: Early adoption = CompetitiveAdvantage, InvestorInterest, & RegulatoryCompliance
💬 How is your industry adapting? 👇 ESG Sustainability NetZero BusinessTransformation
Originally published on LinkedIn on 2025-03-07 05:25:42: https://www.linkedin.com/feed/update/urn%3Ali%3AgroupPost%3A82951-7303647009507336192
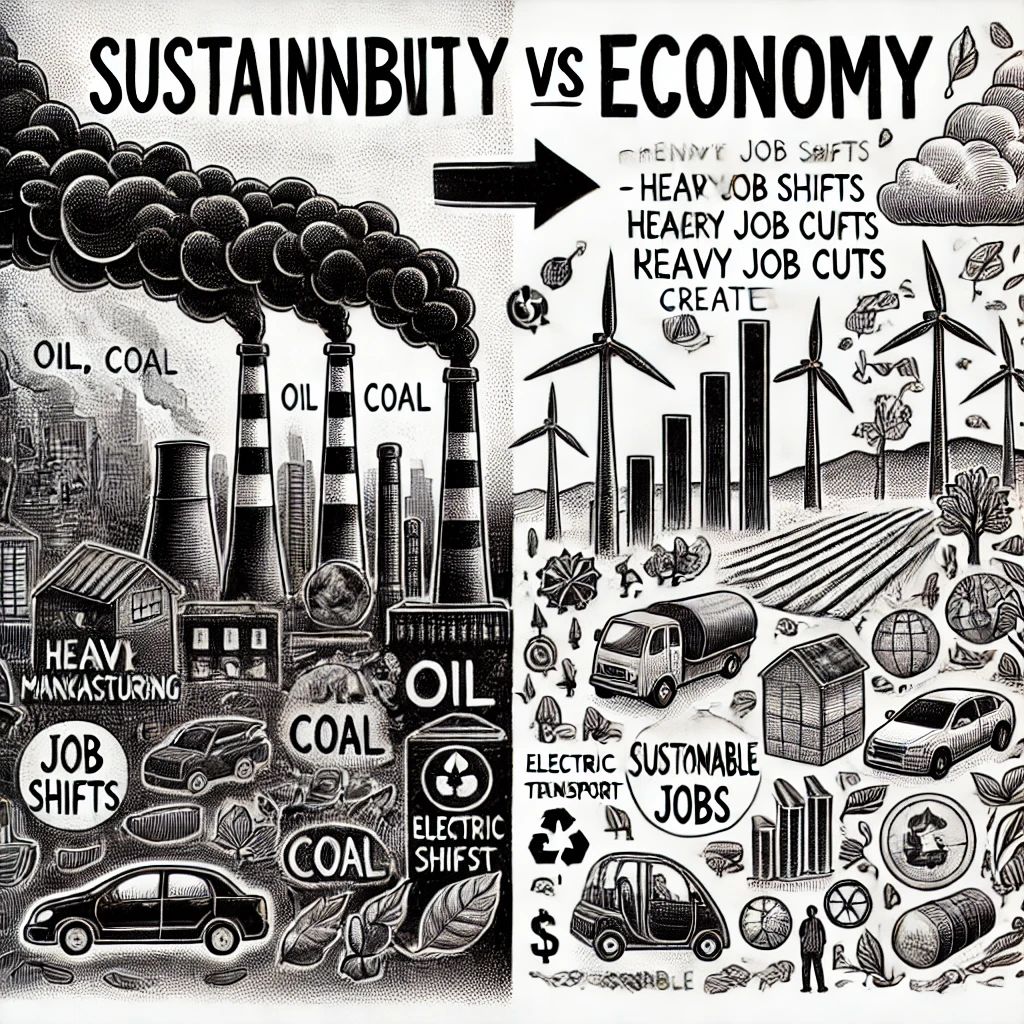
🚨 “TheGreenParadox: If the Top100 Polluters Go Green, Do Economies Go Red?” 🌍💸🔥
71% of global emissions come from just Just100 companies—but what happens if they actually go green?
📊 TheHardNumbers: Who’s Driving Emissions?
🔹 100Companies = 71% of Global Emissions (CDP Carbon Majors Report, 2025)
🔹 TotalMarketValue = $15.4 Trillion (Forbes, 2025)
🔹 Sectors Dominating Emissions:
✔️ Oil & Gas (ExxonMobil, Shell, Aramco, BP, Reliance) – 52% of global industrial CO₂.
✔️ Coal Giants (ChinaEnergy, Peabody, Glencore) – 14% of all emissions, powering entire nations.
✔️ Steel & Cement (ArcelorMittal, Holcim, TataSteel, JSW) – 8% of emissions, critical to infrastructure.
✔️ Shipping & Aviation (Maersk, Boeing, Delta, Emirates) – 5% of emissions, enabling global trade.
🚨 RealityCheck: Transitioning these industries overnight would shake economies to the core.
💰 TheEconomicCrashPotential
🔻 JobLosses in FossilFuel Sectors – 34M jobs globally depend on oil, coal, and heavy industries. (ILO, 2025)
🔻 GDPImpact on EmergingMarkets – India, China, and Indonesia rely on fossilfuels for 20-35% of GDP. (World Bank, 2025)
🔻 SupplyChain Disruptions – 42% of global logistics, steel, and chemicals are tied to high-emission industries. (McKinsey, 2025)
🔻 EnergyTransition Costs – Full decarbonization needs #$275T investment by 2050—but who’s paying? (IEA, 2025)
📌 TheDilemma: Accelerating sustainability risks a financialcrisis, while delaying it fuels climate disaster.
🔄 IsThereAMiddlePath?
🏆 IndustriesFindingBalance:
✅ SaudiAramco’s CarbonCapture Push – #$50B invested, but still expanding fossilfuel extraction.
✅ Tesla & BYD’s EVRevolution – EVs now 18% of global carsales, but lithiummining is a sustainability disaster.
✅ GreenSteel Investments (Hybrit, H2GreenSteel) – Promising tech, but adoption is too slow.
🚨 TheProblem: Green initiatives often don’t move fast enough—or they create new environmental costs.
🏆 KeyTakeaway: The TradeOff No One Wants to Talk About
📌 GoingGreen could be an economic revolution if planned strategically.
📌 ItShouldBe a shift that protects jobs, not eliminates them overnight.
📌 ItWouldBe an economicdisaster if industries collapse before sustainable alternatives scale.
👉 CanTheWorldAffordToDecarbonize without crashing economies? Drop your insights below! 👇
Originally published on LinkedIn on 2025-02-20 03:57:07: https://www.linkedin.com/feed/update/urn%3Ali%3AgroupPost%3A82951-7298188896939479040
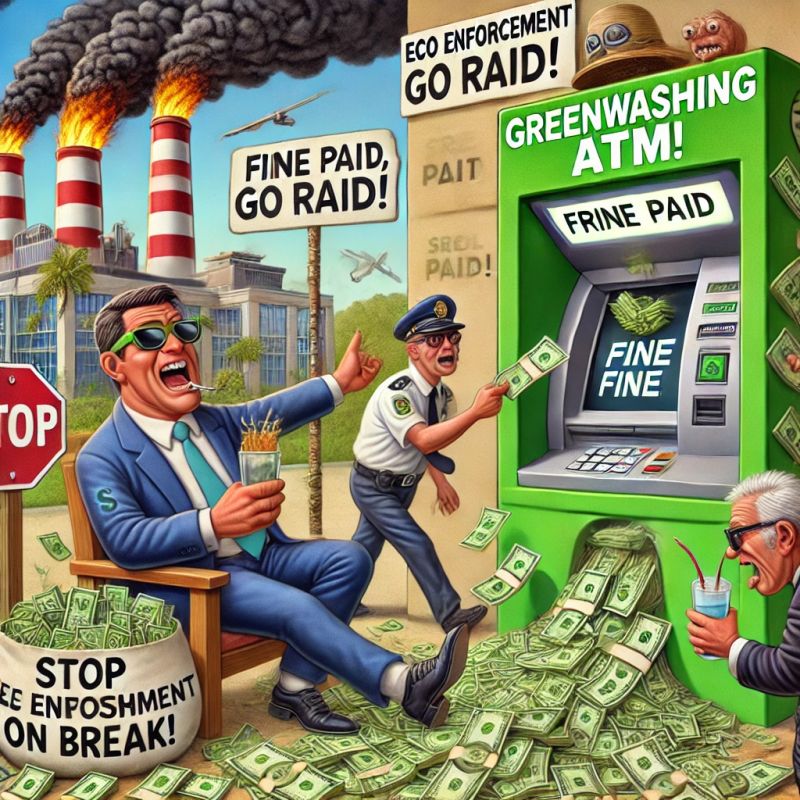
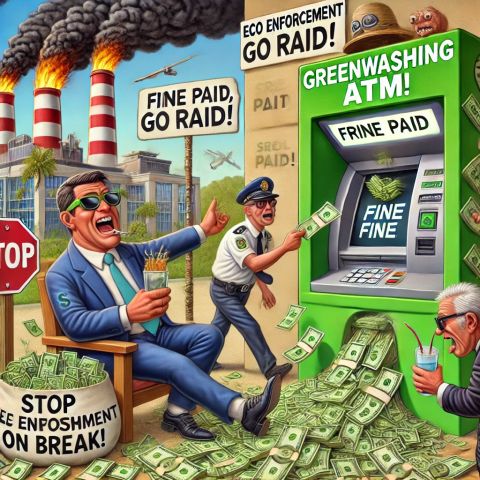
💰 “Green_Fines_or_Green_Profits? Are Environmental Penalties Just Revenue Generators?” 🌍⚖️
Fining a corporation for destroying the planet without enforcing 2change is like giving a speeding ticket to a getaway car—profitable, but pointless.
Governments claim to enforce environmental protection, but are penalties truly about holding polluters accountable—or just another way to boost state revenues without real impact? Let’s look at the numbers.
📊 Who Pays the Most?
✅ Big_Oil & Fossil Fuel Giants 🛢️
✔️ BP, ExxonMobil, Shell – Fined $35B+ globally in the last decade. (Reuters, 2024)
✔️ India: Reliance & ONGC collectively paid ₹8,000 crore ($960M) in pollution fines. (CPCB, 2024)
🚨 Reality Check: Despite massive fines, fossil fuel subsidies still exceed $7 trillion globally. (IMF, 2024)
✅ Mining_Deforestation 🌲🏗️
✔️ Brazil’s Amazon Deforestation Fines – Over $2.3B in penalties, yet deforestation rates hit record highs in 2024. (Greenpeace, 2024)
✔️ Vedanta & Adani Mining (India) – Paid ₹12,500 crore ($1.5B) in fines but continue large-scale mining. (MoEFCC, 2024)
🚨 Reality Check: Fines are often a fraction of profits. Most mining firms budget for environmental penalties instead of stopping damage.
✅ Chemical_Industrial_Waste 🏭
✔️ Dow Chemicals, BASF, Bayer – $8B+ in global penalties for toxic leaks. (EU Commission, 2024)
✔️ India’s Ganga Pollution Cases – Over ₹1,500 crore ($180M) in fines, but pollution still rising. (NGT, 2024)
🚨 Reality Check: Only 30% of fines are actually collected, and cleanup rarely happens. (UNEP, 2024)
⚠️ Who Gets Away?
❌ Agribusiness & Pesticides – Massive groundwater depletion, but minimal regulation.
❌ Fast Fashion & E-Waste – Textile & electronics giants rarely fined for pollution.
❌ Shipping Industry – 1,000+ oil spills yearly, but most fines are under $1M. (IMO, 2024)
📌 Reality Check: Governments focus on fining profitable industries while ignoring sectors with long-term damage.
🏆 KeyTakeaway: Are Green Fines Just A Cost of Doing Business?
✔️ Fines need to be reinvested in cleanup & prevention—not just govt revenue.
✔️ Penalties should scale with profits—polluters shouldn’t budget for damage.
✔️ Transparency matters—where do these billions in environmental fines actually go?
👉 Should penalties be about revenue or real accountability? Let’s discuss! 👇

Originally published on LinkedIn on 2025-02-17 13:29:00: https://www.linkedin.com/feed/update/urn%3Ali%3AgroupPost%3A9088131-7297245653515079680
NamasteIndia – Reasons for India’s High Anti-Dumping Cases**:
Market Size: India’s large consumer market attracts foreign suppliers, leading to increased trade volume and potential disputes.
Domestic Industry Protection**: India uses anti-dumping measures to safeguard local industries from unfair competition by imported goods.
Global Trade Dynamics: As a major player in international trade, India encounters more instances of dumping practices.
Sector-Specific Issues: Certain sectors, such as steel, chemicals, and textiles, face intense competition and are prone to anti-dumping actions.
Originally published on LinkedIn on 2024-07-27 13:34:14: https://www.linkedin.com/feed/update/urn%3Ali%3AgroupPost%3A60128-7222957457717792768
NamasteIndia – Reasons for India’s High Anti-Dumping Cases**:
Market Size: India’s large consumer market attracts foreign suppliers, leading to increased trade volume and potential disputes.
Domestic Industry Protection**: India uses anti-dumping measures to safeguard local industries from unfair competition by imported goods.
Global Trade Dynamics: As a major player in international trade, India encounters more instances of dumping practices.
Sector-Specific Issues: Certain sectors, such as steel, chemicals, and textiles, face intense competition and are prone to anti-dumping actions.
Originally published on LinkedIn on 2024-07-27 13:34:07: https://www.linkedin.com/feed/update/urn%3Ali%3Ashare%3A7222957429288783872

