OilIndustry Insights from CERAWeek 2025: Policy Shifts & Market Trends
🚀 The energy transition is happening—but not at oil’s expense! At CERAWeek2025, leaders emphasized that while renewables are growing, oil remains the backbone of the global economy. The data proves it. 📊
KeyTakeaways
📌 Regulatory Rollbacks → Boosting U.S. Oil
🔹 New drilling permits +30% YoY
🔹 Pipeline approvals 20% faster
🔹 Methane emission restrictions eased
🔹 $4B in subsidies extended
📌 Production Surge → Record Output Expected
🔹 U.S. crude production: 13.6M bpd (new all-time high)
🔹 Global oil demand: 103M bpd (IEA forecast for 2025, up from 99M in 2023)
🔹 China & India energy demand: +3.5% YoY 📈
🔹 OPEC+ market share: 30% (stabilized despite U.S. surge)
📌 Investment Boom → Capital Inflows Rising
🔹 Oil & gas CapEx: $150B (+25% YoY)
🔹 Private equity up 40% in fossil fuel projects
🔹 Mergers & Acquisitions: Exxon-Pioneer ($59.5B) & Chevron-Hess ($53B)
📌 OilPrices & Market Volatility
🔹 Brent: $82/barrel 📈 (Jan: $75)
🔹 WTI: $79/barrel 📈
🔹 U.S. gasoline prices: $3.60/gal (projected: $3.50-$4.10)
🔹 Russia oil exports: Down 15% due to sanctions, tightening supply
📌 Challenges & Uncertainties
⚠ Regulatory flip-flops? Election risks loom
⚠ Climate policies? ESG backlash impacting funding
⚠ Geopolitical risks? OPEC+, China, Russia sanctions creating price swings
OilIsHereToStay 🔥
💡 The numbers prove oil isn’t going anywhere anytime soon!
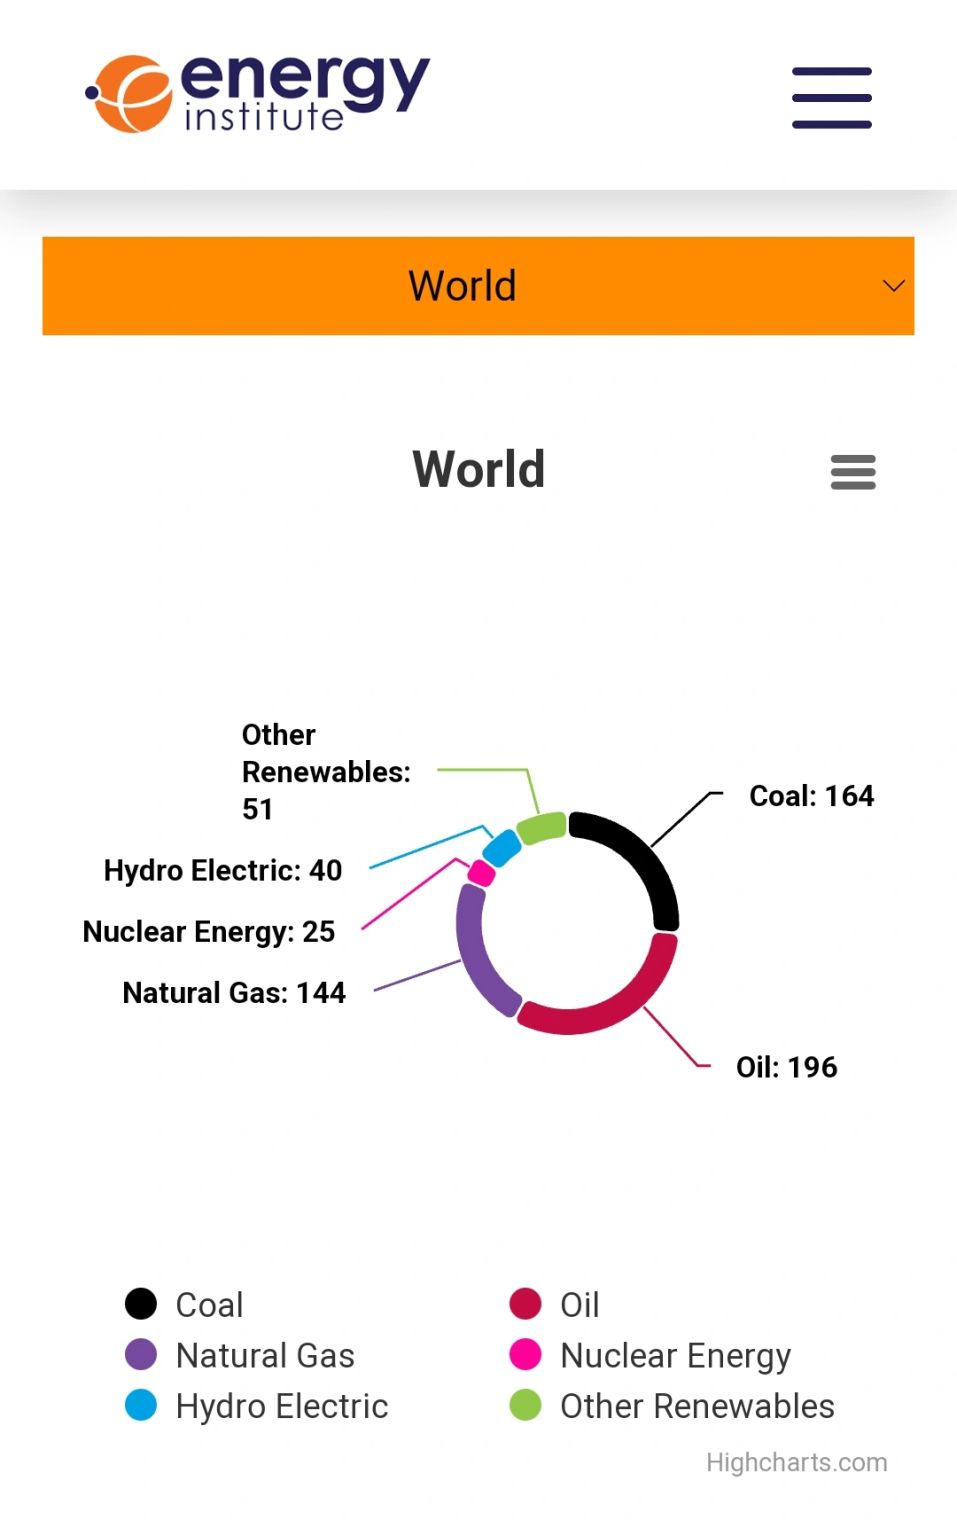
📊 Renewables vs. Fossil Fuels (Global Energy Share, 2025)
🔸 Oil & Gas: 53%
🔸 Coal: 26%
🔸 Renewables (Solar, Wind, Hydro): 30% (growing, but still behind)
🔸 Nuclear: 6%
📊 EV Adoption vs. Internal Combustion Engines (ICE)
🚗 EVs: 15% of global car sales (but still <2% of total cars on roads)
⛽ ICE Vehicles: 85% of sales and 98% of global fleet still oil-powered
📊 Industrial Energy Demand Still Oil-Heavy
🏭 Aviation fuel demand: 7.4M bpd (record high)
🚢 Shipping industry oil reliance: 99% of cargo fleets use fossil fuels
🏗 Petrochemical dependence: Plastics, fertilizers, and pharmaceuticals rely on 30M bpd of oil-based inputs
🔋 Battery storage, grid capacity, and renewables intermittency mean oil and gas remain essential for stable energy supply.
What’sNext?
🔹 Oil dominance isn’t ending—it’s adapting to a dual-energy future
🔹 Fossil fuels + renewables must work together for global energy security
🔹 Policy shifts will continue shaping industry investments and pricing
💬 What do you think? Will oil still lead in 2040? ⬇️ Drop your thoughts! EnergyTransition OilAndGas FutureOfEnergy Sustainability

Originally published on LinkedIn on 2025-03-16 14:25:02: https://www.linkedin.com/feed/update/urn%3Ali%3AgroupPost%3A82093-7307044228021288960
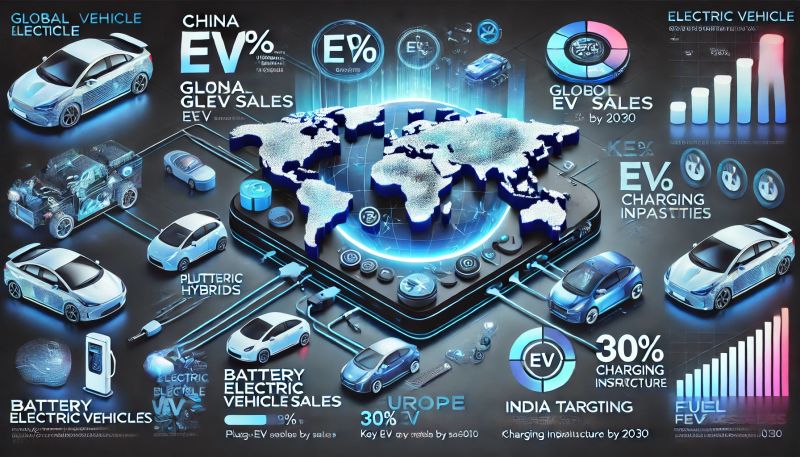
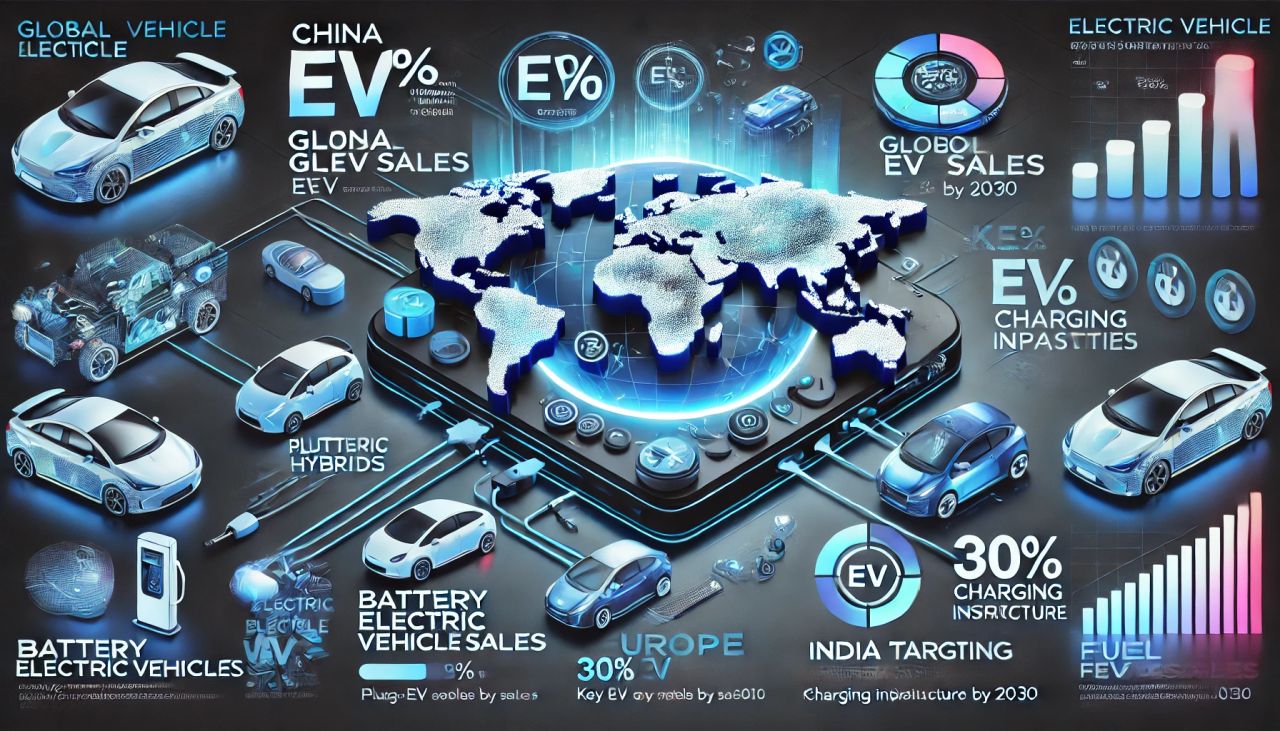
🚗⚡ EV KnowledgeSeries – Global_Perspective
🔋 What is an EV?
🔹 Uses electric motors for propulsion, reducing fossil fuel dependency.
🔹 Lowers carbon footprint, improves energy efficiency.
🔌 Types of EVs
🔋 BEVs: Fully electric, no fuel. ⚡ Tesla Model 3, Nissan Leaf
🔋 HEVs: Fuel + electric motor, self-charging. 🚗 Toyota Prius, Honda City e:HEV
🔋 PHEVs: Can be externally charged + fuel engine. 🔌 BMW 330e, Mitsubishi Outlander PHEV
🔋 FCEVs: Hydrogen fuel cell-powered. 💧 Toyota Mirai, Hyundai Nexo
📈 Global EV Market Trends
🔹 #🌍 Market Share (2024)
🔋 China: 🇨🇳 60% global EV sales.
🔋 Europe: 🇪🇺 30%+ EV adoption, Norway 80% EV sales.
🔋 USA: 🇺🇸 Rapid Tesla-led expansion.
🔋 India: 🇮🇳 5% market share, 30% target by 2030.
🔹 #🚘 Top EV Brands (2024)
🔋 #🥇 BYD (China) – 3.0M units.
🔋 #🥈 Tesla (USA) – 2.5M units.
🔋 #🥉 Volkswagen (Germany) – 1.5M units.
🔋 #🏅 Hyundai-Kia (Korea) – 1.2M units.
🔋 #🎖 Tata Motors (India) – 200K units.
⚡ EV Charging Infrastructure
🔹 #🚀 Charging Types
🔋 AC Slow Charging: ⏳ 6-12 hours (home, public).
🔋 DC Fast Charging: ⚡ 30-60 mins (public stations).
🔋 Ultra-Fast Charging: 🚀 <15 mins (Tesla Superchargers).
🔹 #🌍 Global Charging Stats
🔋 China: 🇨🇳 5M+ chargers (largest).
🔋 Europe: 🇪🇺 2.5M+ chargers.
🔋 USA: 🇺🇸 800K+ chargers.
🔋 India: 🇮🇳 10K+ chargers, 1M target by 2030.
🏛 Government Policies & Incentives
🔹 #💰 EV Incentives (2024)
🔋 #🇺🇸 USA: $7,500 tax credit.
🔋 #🇨🇳 China: Subsidies + free EV license plates.
🔋 #🇪🇺 EU: CO₂ limits, ICE ban 2035.
🔋 #🇮🇳 India: FAME-II, 5% GST, state subsidies.
🔹 #🚫 Emission Regulations
🔋 EU: ICE ban by 2035.
🔋 California: 100% ZEVs by 2035.
🔋 China: 40% EV target by 2030.
🚧 EV Challenges & Solutions
🔹 #⚠️ Challenges
🔋 Battery Cost & Supply – Lithium shortage.
🔋 Charging Infra – Insufficient fast chargers.
🔋 Range Anxiety – Fear of running out of charge.
🔋 High Cost – EVs costlier than ICE cars.
🔋 Grid Strain – Rising power demand.
🔹 #💡 Solutions
🔋 #✅ Battery Innovation – Solid-state tech.
🔋 #✅ Faster Charging – Ultra-fast networks.
🔋 #✅ Policy Push – More subsidies & infra funding.
🔮 Future of EVs – What’s Next?
🔹 #📌 2030+ Predictions
🔋 #🔹 EVs = 40-50% of new sales.
🔋 #🔹 50% cheaper batteries.
🔋 #🔹 Hydrogen FCEVs for trucking.
🔋 #🔹 V2G tech: EVs power grids.
🔋 #🔹 Solar-powered EVs.
🚀 TheEVRevolutionIsNow SustainableMobility TheFutureIsElectric
Originally published on LinkedIn on 2025-03-10 13:29:07: https://www.linkedin.com/feed/update/urn%3Ali%3Ashare%3A7304855827301961729
KnowledgeSeries: ZeroPCF Intermediaries – The Future of SustainableIndustry
🔍 WhatAreZeroPCFIntermediaries?
✔ LowCarbon materials reducing Scope3Emissions
✔ 76% of companies committed to NetZero by 2030
📌 KeySectorsBenefiting:
🏭 Manufacturing – 32% emissions cut using LowCarbonMetals
⚕ Pharma – 28% of APIs now sourced from SustainableFeedstocks
♻ Chemicals – 41% surge in BiobasedAlternatives demand
🛢 Energy – GreenHydrogen market to grow $500B by 2050
💰 GreenFinance & CarbonPricing:
✔ $1.2T+ in ClimateFinance by 2025
✔ CarbonMarkets to grow 5X by 2030
✔ 68% of ESGFunds prioritize ZeroPCFAdopters
📜 RegulatoryPush:
✔ CBAM (Carbon Border Adjustment Mechanism) – 20% tariff hike on HighCarbonImports
✔ NetZeroMandates – 1500+ firms now LegallyBound to cut emissions
✔ GovIncentives – 40+ countries offer tax benefits for ZeroPCFManufacturing
🚧 Challenges:
⚠ CostFactor – 27% higher initial investment
⚠ SupplyChainAdaptation – 60% of suppliers lack PCFcertification
⚠ VerificationComplexity – 48% struggle with CarbonTracking
📈 TheFuture:
🌱 AIDrivenCarbonTracking – 80% adoption in SupplyChains by 2030
🚀 GreenMaterialsMarket projected at $600B by 2035
📊 InvestorFocus – Companies with LowCarbonFootprint see 35% valuation premium
👉 ActionPoint: Early adoption = CompetitiveAdvantage, InvestorInterest, & RegulatoryCompliance
💬 How is your industry adapting? 👇 ESG Sustainability NetZero BusinessTransformation
Originally published on LinkedIn on 2025-03-07 05:25:42: https://www.linkedin.com/feed/update/urn%3Ali%3AgroupPost%3A82951-7303647009507336192
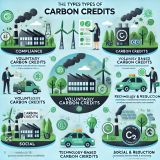
KnowledgeSeries – Decoding Carbon Credits: Which Ones Truly Make an Impact?
Carbon credits are essential tools in the fight against climate change, but not all credits are created equal. Here’s a quick guide to understanding their types and impact.
🌍 Compliance Carbon Credits
✅ Regulated Offsets – Mandatory under government-led carbon markets.
✅ Examples: EU ETS, California Cap-and-Trade, China ETS.
✅ Who Uses Them? Heavy industries, power plants, airlines, and corporations with emission limits.
💡 Voluntary Carbon Credits
✅ Market-Driven Offsets – Purchased by businesses and individuals to meet sustainability goals.
✅ Examples: Renewable Energy Credits (RECs), Forestry & Land Use, Methane Capture.
✅ Who Uses Them? Airlines, event organizers, eco-conscious brands.
🌱 Nature-Based Carbon Credits
✅ Carbon Sequestration – Uses ecosystems to absorb CO₂.
✅ Examples: Reforestation, Blue Carbon (Mangroves & Seagrass), Soil Carbon Farming.
✅ Why It Matters? Restores biodiversity, improves water cycles, and benefits local communities.
🔬 Technology-Based Carbon Credits
✅ Innovative Carbon Removal – Uses advanced tech to pull carbon from the air.
✅ Examples: Direct Air Capture (DAC), Carbon Capture & Storage (CCS), Waste-to-Energy.
✅ Challenges: High cost, scalability, and energy consumption.
⚡ Avoidance & Reduction Credits
✅ Preventing Emissions at the Source – Focuses on eliminating carbon before it’s released.
✅ Examples: Wind & Solar Energy, Energy Efficiency, Clean Cooking Stoves.
✅ Why It’s Crucial? Immediate impact with proven effectiveness.
🤝 Social Carbon Credits
✅ Climate + Community Benefits – Supports sustainability while improving lives.
✅ Examples: Sustainable Farming, Water Purification, Community Reforestation.
✅ Beyond Carbon? Jobs, education, and health improvements.
🔥 Biochar Carbon Credits
✅ Long-Term Carbon Storage – Converts biomass into stable carbon that remains in the soil.
✅ Benefits: Boosts soil health, prevents methane release, locks carbon for centuries.
✅ The Future? High permanence with agricultural benefits.
Which Carbon Credit Makes the Most Impact?
✅ Compliance Credits – Necessary but market-dependent.
✅ Voluntary Credits – Flexible, but risk of greenwashing.
✅ Nature-Based – Cost-effective and high-impact.
✅ Tech-Based – Promising, but expensive.
✅ Avoidance & Social Credits – Immediate reductions with co-benefits.
✅ Biochar – One of the most durable carbon storage solutions.
💬 Which one do you think has the highest potential for a net-zero future? Comment below!
Sustainability CarbonMarkets NetZero ClimateAction
Originally published on LinkedIn on 2025-03-06 08:05:21: https://www.linkedin.com/feed/update/urn%3Ali%3AgroupPost%3A100646-7303324797692747776
📚 KnowledgeSeries: Sustainability Taxonomy – The Rulebook for Green Investments 🌱💰
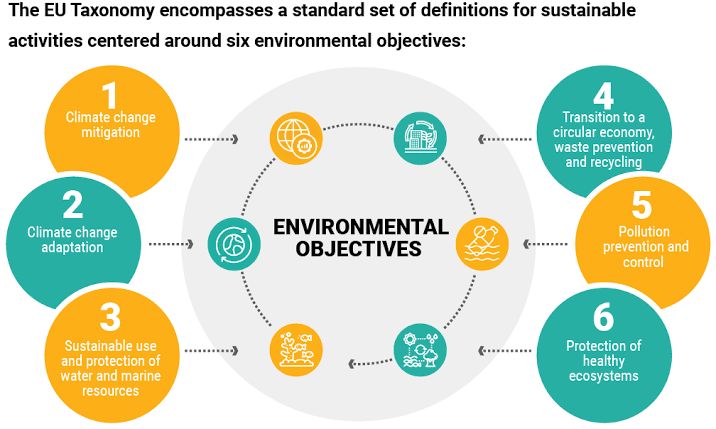
As #$5T in ESG investments grows, defining what is truly sustainable is critical. Enter Sustainability Taxonomy—a classification system ensuring green capital flows into real climate solutions, not greenwashing.
📊 EU Taxonomy – Setting the Global Standard
🟢 6 Environmental Objectives → Activities must significantly contribute to at least one while causing no harm to others:
Climate Change Mitigation
Climate Change Adaptation
Water & Marine Resource Protection
Circular Economy Transition
Pollution Prevention & Control
Biodiversity & Ecosystem Restoration
🟢 Impact → Covers 50K+ companies, shaping 80% of EU capital markets. (Source)
🟢 Challenges → Simplification Omnibus (2025 Proposal) could reduce company reporting, raising concerns about greenwashing risks. (Source)
🌍 Global Adoption: Who’s Following the EU Model?
🟢 Australia → Developing Sustainable Finance Taxonomy to attract #$200B+ in green capital. (Source)
🟢 China → Green Bond Principles aligned with EU Taxonomy in 2023, covering #$150B+ in issuances.
🟢 ASEAN → Launched ASEAN Taxonomy 2024, targeting climate finance growth in 10 nations.
🟢 US & UK → No official taxonomy, relying on SEC climate rules & UK Green Finance Strategy instead.
🔥 The Takeaway: Green Finance Needs Clear Rules
📌 #$5T+ ESG investments need clarity—taxonomy prevents greenwashing.
📌 EU model sets the benchmark, but simplification risks loosening standards.
📌 More countries adopting taxonomies → Will we see a global standard soon?
📢 Do we need a worldwide taxonomy for sustainability? Let’s discuss! 👇
Originally published on LinkedIn on 2025-03-04 03:47:30: https://www.linkedin.com/feed/update/urn%3Ali%3AgroupPost%3A2474261-7302535131989164034
NamasteGreenIndia’s Carbon Market: A Game Changer or Just Another Framework?” 🇮🇳💨
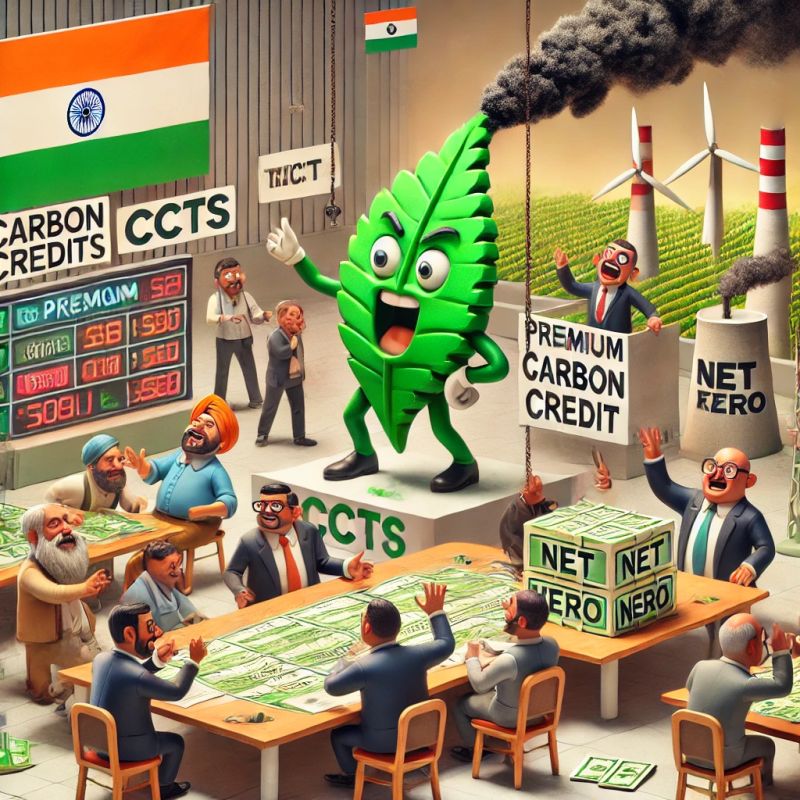
India is making big moves in the carbon credit space with the Indian Carbon Market (ICM), but is it ready to deliver real impact? Here’s a data-driven breakdown of the Carbon_Credit_Trading_Scheme (CCTS) and what’s next.
🔍 What is the Indian Carbon Market (ICM)?
✅ Launched in June 2023 to enable carbon credit trading & cut emissions. (Source: Govt. of India, 2023)
✅ Aims to align with India’s Nationally Determined Contributions (NDCs) under the Paris Agreement.
✅ Regulated under the Carbon Credit Trading Scheme (CCTS), officially notified in June 2023 & amended in December 2023.
🏆 Why It Matters: India is one of the world’s top 3 carbon emitters, and this framework could reshape industries while driving carbon reductions.
📊 Current Status of CCTS
🛠 10 key sectors approved under the Offset Mechanism. (Source: Bureau of Energy Efficiency, 2024)
🚀 Phase 1 covers 6 sectors, with 12 methodologies developed for implementation. (BEE, Sept 2024)
🚨 Challenges:
Pricing clarity & credit validation remain uncertain.
Will industries truly cut emissions, or just buy offsets?
⚡ What’s Next for India’s Carbon Market?
📈 Expansion to more sectors, increasing carbon credit liquidity.
🌱 Stronger enforcement needed to prevent greenwashing.
🌍 Alignment with global carbon markets for international trading opportunities.
🏆 Final Verdict: High potential but execution will decide success.
KeyTakeaway
India’s Carbon Credit Trading Scheme (CCTS) could be a major climate tool, but real impact depends on strong enforcement & pricing mechanisms.
👉 Will India’s carbon market drive real change, or just be another framework?
IndiaCarbonMarket Sustainability ClimateAction NetZero CarbonCredits ESG
Originally published on LinkedIn on 2025-01-30 10:52:26: https://www.linkedin.com/feed/update/urn%3Ali%3Ashare%3A7290683269031907328
NamasteGreenIndia’s Ethanol Revolution: Achieving 20% Blending with a Sustainable Edge
India is on the brink of achieving a 20% ethanol blending target, a transformative step towards energy independence, environmental sustainability, and agricultural empowerment. Here’s how this revolution is shaping up:
📈 The Progress So Far
🟢 2014: Ethanol blending in petrol was just 1.53%.
🟢 2024: Achieved 15%, with 4.62 million metric tonnes (MMT) of ethanol produced.
🟢 2025 Target: Projected to produce 10.2 MMT annually to meet blending and industrial needs.
🌍 Economic & Environmental Wins
💰 USD 4 Billion Saved: Annual savings on crude oil imports.
🌎 10 MMT CO₂ Reduced: Emissions cut significantly with 20% ethanol blending.
👷 500,000 Jobs Created: Boosting rural employment through distilleries and supply chains.
🚢 USD 300 Million Export Potential: Surplus ethanol positioned for international markets.
🚗 Automotive Industry’s Ethanol Push
🔧 Flex-Fuel Vehicles: Tata Motors, Mahindra, Maruti Suzuki, and Hyundai to launch 100% bio-ethanol vehicles within six months.
🛢️ Fossil Fuel Demand Cut: Flex-fuel vehicles to reduce reliance on fossil fuels by 5.5 MMT annually.
🏭 Toyota’s Commitment: Investing ₹20,000 crore (USD 2.4 billion) in ethanol-compatible vehicle production.
🌾 Agricultural Boost
🌱 8-9 MMT of Sugar: Diverted annually for ethanol production, stabilizing prices and supporting farmers.
🌾 1.5 MMT of Surplus Grains: Utilized for ethanol, ensuring sustainable revenue for agriculture.
⚡ Challenges & Opportunities
📊 Feedstock Demand: India needs an additional 2 MMT of sugarcane and 1.5 MMT of surplus grains for sustainable production.
🏗️ Infrastructure Gaps: Only 30% of fuel pumps are ready for E20 blending.
🌍 Global Leadership: Scaling production and refining distribution could position India as a leader in ethanol exports.
💡 Why This Matters
India’s ethanol revolution is more than a blending target—it’s about energy self-reliance, cutting carbon footprints, and empowering rural economies. This initiative showcases India as a global benchmark for sustainable energy transitions.
💬 Let’s discuss how India’sEthanolJourney is driving SustainableEnergy, AutomotiveInnovation, and RuralEmpowerment! 🚀
Originally published on LinkedIn on 2025-01-16 09:51:29: https://www.linkedin.com/feed/update/urn%3Ali%3AgroupPost%3A12538632-7285594503120347137
NamasteGrowthIndia’s Manufacturing Revolution: Beating China’s Export Curbs with a $24 Billion Strategic Push
The Challenge: Impact of China’s Export Curbs
1. 📉 Electronics: Restrictions on gallium and germanium caused a 25% rise in production costs, delaying projects under India’s $1.2 billion PLI scheme for semiconductors.
2. 🌞 Renewables: SolarPV module prices jumped 30%, leading to an 18% drop in 2024 capacity additions. India imports 80% of solar modules from China.
3. 🚗 EVs: Lithium-ion battery prices increased 25%, slowing EV production by 12%. EV sales growth fell to 34% in 2024 from 58% in 2023.
4. ⚙️ Machinery: A 15% drop in Chinese precision machinery exports raised operational costs. Textile exports fell 8% due to machinery shortages impacting production.
The $24 Billion Strategy to Overcome
1. DiversifyingSupplyChains:
Partnering with Australia, Vietnam, and SouthKorea for critical materials like lithium, cobalt, and rareearths.
Imports from non-China suppliers surged 20% in 2024.
2. BoostingDomesticManufacturing:
$24 billion PLI schemes targeting semiconductors, EVs, and solarpanels.
Vedanta and Tata investing $9.6 billion in chip manufacturing; production starts by 2026.
Expanding solar module capacity to 100 GW by 2030 (currently 40 GW).
3. StrengtheningRenewableEnergy:
Gigafactories for lithium-ion batteries under advanced chemistry PLI schemes.
R&D focus on sodium-ion batteries as an alternative to lithium.
4. StockpilingCriticalMaterials:
Strategic reserves of lithium, cobalt, and rareearths to mitigate supply chain disruptions.
5. SkillDevelopment and Innovation:
Launching national R&D hubs for semiconductors and renewable energy.
Upskilling the workforce for advanced manufacturing.
The Numbers That Matter
🟢 Renewables: India reached 209.44 GW capacity (+15.84% YoY) in 2024.
🔋 Semiconductors: Domestic chip production to reduce $19 billion in annual imports by 2026.
🌞 Solar: Domestic manufacturing grew 35% YoY, reducing dependency on Chinese imports.
🌍 EVGrowth: India’s battery gigafactories will reduce import reliance by 40% by 2028.
Why This Matters
India is turning challenges into opportunities by reshaping its supplychains, investing heavily in localcapabilities, and reducing reliance on China.
With a $24 billion plan, India is not just weathering the storm—it’s leading a ManufacturingRevolution and setting the stage to become a global powerhouse.
Source / shared link: https://mybs.in/2ejuSuZ
Originally published on LinkedIn on 2025-01-14 15:26:11: https://www.linkedin.com/feed/update/urn%3Ali%3AgroupPost%3A3880479-7284953957133602818
NamasteSmartIndia’s Manufacturing Revolution: Beating China’s Export Curbs with a $24 Billion Strategic Push
The Challenge: Impact of China’s Export Curbs
1. 📉 Electronics: Restrictions on gallium and germanium caused a 25% rise in production costs, delaying projects under India’s $1.2 billion PLI scheme for semiconductors.
2. 🌞 Renewables: SolarPV module prices jumped 30%, leading to an 18% drop in 2024 capacity additions. India imports 80% of solar modules from China.
3. 🚗 EVs: Lithium-ion battery prices increased 25%, slowing EV production by 12%. EV sales growth fell to 34% in 2024 from 58% in 2023.
4. ⚙️ Machinery: A 15% drop in Chinese precision machinery exports raised operational costs. Textile exports fell 8% due to machinery shortages impacting production.
The $24 Billion Strategy to Overcome
1. DiversifyingSupplyChains:
Partnering with Australia, Vietnam, and SouthKorea for critical materials like lithium, cobalt, and rareearths.
Imports from non-China suppliers surged 20% in 2024.
2. BoostingDomesticManufacturing:
$24 billion PLI schemes targeting semiconductors, EVs, and solarpanels.
Vedanta and Tata investing $9.6 billion in chip manufacturing; production starts by 2026.
Expanding solar module capacity to 100 GW by 2030 (currently 40 GW).
3. StrengtheningRenewableEnergy:
Gigafactories for lithium-ion batteries under advanced chemistry PLI schemes.
R&D focus on sodium-ion batteries as an alternative to lithium.
4. StockpilingCriticalMaterials:
Strategic reserves of lithium, cobalt, and rareearths to mitigate supply chain disruptions.
5. SkillDevelopment and Innovation:
Launching national R&D hubs for semiconductors and renewable energy.
Upskilling the workforce for advanced manufacturing.
What_happens_in_India
🟢 Renewables: India reached 209.44 GW capacity (+15.84% YoY) in 2024.
🔋 Semiconductors: Domestic chip production to reduce $19 billion in annual imports by 2026.
🌞 Solar: Domestic manufacturing grew 35% YoY, reducing dependency on Chinese imports.
🌍 EVGrowth: India’s battery gigafactories will reduce import reliance by 40% by 2028.
Why This Matters
India is turning challenges into opportunities by reshaping its supplychains, investing heavily in localcapabilities, and reducing reliance on China.
With a $24 billion plan, India is not just weathering the storm—it’s leading a ManufacturingRevolution and setting the stage to become a global powerhouse.
Source / shared link: https://mybs.in/2ejuSuZ
Originally published on LinkedIn on 2025-01-14 15:22:08: https://www.linkedin.com/feed/update/urn%3Ali%3AgroupPost%3A10020629-7284952938307817472
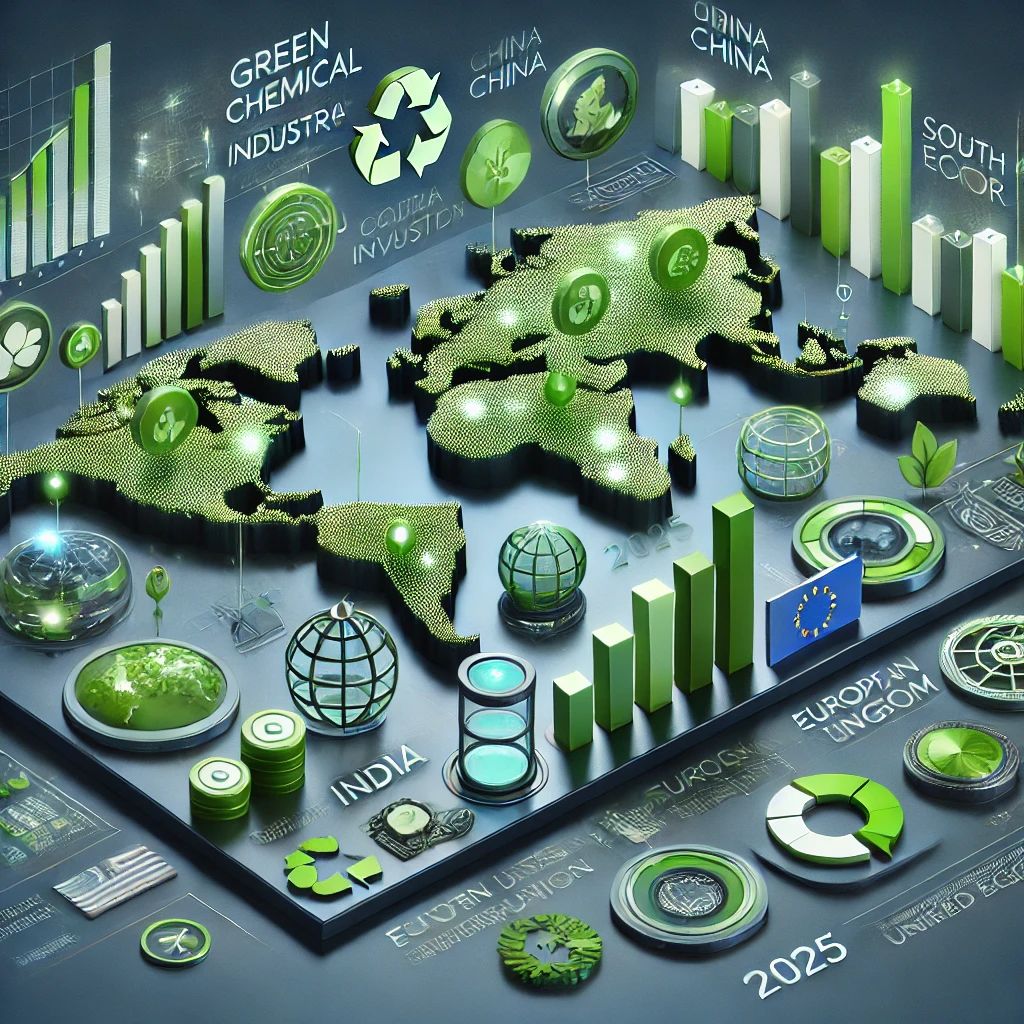
Global Chemical Industry 2025: Challenges, Growth, and the Green Transition
Additonal_costs_for_GreenChemcals_20%???
The USD 6.3 trillion global chemical industry is navigating a pivotal year, facing regulatory hurdles, rising costs, and the demand for sustainability. With green investments surging, YR2025 marks a transformative period for this vital sector.
📊 India
🌟 $383 billion market projected by 2030.
🌟 Environmental compliance costs up 20%.
🌟 Part of Asia-Pacific’s $51.41 billion green chemical market in 2024.
🧪 China
🌟 70% of hazardous producers impacted by stricter safety laws.
🌟 Sustainability spending increased by 15% in 2025.
🌟 Driving Asia-Pacific green market to $137.73 billion by 2034 (CAGR 10.35%).
🌱 Japan
🌟 9.6% CAGR in green chemical investments (2023-2033).
🌟 Prioritizing hydrogen and clean energy for carbon neutrality by 2050.
🌿 South Korea
🌟 15% YoY rise in K-REACH compliance costs.
🌟 Major investments in AI-driven carbon capture technologies.
💧 United States
🌟 PFAS compliance costs exceed $1 billion.
🌟 Green market grew from $64.52 billion (2023) to $71.82 billion (2024), projected to reach $141.33 billion by 2030 (CAGR 11.85%).
🌍 European Union
🌟 REACH compliance costs increased by 30%.
🌟 $50 billion invested in circular economy initiatives.
🌟 Green market projected to reach $387.97 billion by 2034.
⚡ United Kingdom
🌟 Production output dropped 10% since 2021 due to high energy costs.
🌟 Ineos halts ethanol production at Grangemouth.
Global Trends in 2025
📈 Energy Costs
🌟 Increased by 20%-30%, challenging operational efficiencies.
🛠️ Compliance Challenges
🌟 Over 50% of companies report regulation as their top concern.
🌱 Sustainability Investments
🌟 Expected to exceed $150 billion, emphasizing green chemistry and circular economy goals.
The Road Ahead
🌟 The industry’s transformation depends on innovation, collaboration, and green investment strategies. With strategic actions, the chemical sector is poised to lead in shaping a sustainable, resilient global economy.
Let’s connect to build a sustainable future together! 🌍✨
Originally published on LinkedIn on 2025-01-13 16:33:25: https://www.linkedin.com/feed/update/urn%3Ali%3AgroupPost%3A3880479-7284608488431906816

