WHEN_SHIT_STARTS_FLYING, FOLLOW THE CARBON.
Dr. Anju Sharma MrsSustainability
Village gobar gas was a near-perfect local loop:
Dung → Digester → Cookstove → Digestate → Soil
Waste became energy. Nutrients stayed local. Almost nothing moved.
IndustrialCBG changes the equation.
The moment a local manure loop becomes a centralised energy business, it acquires:
Aggregation → Trucks → Upgrading → Compression → Storage → Distribution → Digestate logistics
The chemistry is the same.
The carbon system is not.
TheHiddenCarbon
Take a 100 t/day plant sourcing wet biomass over an average 50 km.
100 t × 50 km = 5,000 tonne-km/day
At ~0.12 kg CO₂e/tonne-km:
→ ~220 t CO₂e/year
from loaded inbound freight alone.
Not counted:
Empty backhaul
Digestate return
Compression power
CBG distribution
Steel + concrete + plant equipment
And then comes methane.
Biogas/biomethane systems can lose around 2–5.5% of methane output across digestion, upgrading, storage & handling.
That can mean roughly:
1 t CH₄ produced → ~0.5–1.5 t additional CO₂e on a 100-year basis.
That is not an operational footnote.
It can materially erode the climate advantage before logistics, electricity & infrastructure even enter the ledger.
TheStrategicBlindSpot
The atmosphere does not distinguish between methane from a gas field & methane from a cowshed.
It responds to the molecule.
That is why the global biomethane debate is already moving from:
Renewable origin → Verified lifecycle performance
EU, UK, US, Denmark & Brazil increasingly focus on some combination of:
Feedstock eligibility | lifecycle GHG thresholds | methane leakage | chain-of-custody | actual emissions avoided
India should be asking the same question.
Capturing manure that would otherwise decay anaerobically & emit methane can create real climate value.
But:
Long feedstock radius + wet-biomass trucking + residue removal + methane slip + compression energy ≠ automatically green
PolicyInversion
If policy rewards:
Installed capacity + tonnes of CBG
the system optimises for volume.
If policy rewards:
Verified net CO₂e avoided
the system optimises for:
↓ Methane leakage
↓ Feedstock radius
↓ Fossil logistics
↑ Genuine waste diversion
↑ Digestate return
↑ Lifecycle carbon integrity
That is the difference between a bioenergy programme & a decarbonisation programme.
The real KPI should therefore be:
Net CO₂e avoided / unit of useful energy
Not merely tonnes of gas produced.
The full CarbonLedger must include:
Feedstock km | methane slip | transport fuel | compression power | digestate fate | soil-carbon impact | infrastructure footprint | counterfactual emissions
As once policy rewards capacity before carbon performance, the pattern becomes predictable:
Build first → Certify green → Audit later.
So when shit starts flying across districts:
Follow the carbon not the certificate.
Originally published on LinkedIn on 2026-08-09 16:10:45: https://www.linkedin.com/feed/update/urn%3Ali%3Ashare%3A7492251033277100032
KtalystFuelFlex Series 101:
The Macroeconomic Reality of Fuel Contamination
Fuel Flex is often misread as petty adulteration or local distributor malpractice.
That framing is no longer sufficient.
Modern fuel fraud operates as a systemic mechanism of fiscal leakage, subsidy capture, market distortion and climate-accounting failure. It weakens sovereign tax bases, diverts public incentives, penalizes legitimate market participants and puts green-transition credibility at risk.
The damage sits across four economic vectors:
1. Fiscal Leakage
Liquid fuels are high-volume, high-tax commodities. When untaxed or lower-taxed products are blended into commercial fuel streams, the state loses core fiscal yield. SARS estimates fuel adulteration drains approximately R3.6 billion annually from South Africa’s national fiscus.
2. Subsidy Capture
In green fuel markets, weak verification can turn policy support into an extraction mechanism. In the Washakie Renewable Energy case, a coordinated conspiracy generated $1.16 billion in fraudulent biofuel tax credits and extracted $511 million in IRS cash payouts.
3. Market Capture
Fraudulent or weakly verified supply creates artificial cost advantage. Under the U.S. Renewable Fuel Standard, the EPA Office of Inspector General identified nearly 339 million fraudulent RINs, linked to $87 million in illicit transactions. Ghost compliance supply dilutes legitimate credit value and undermines genuine producers.
The risk is also visible in global feedstock flows. Reuters reported that Chinese used cooking oil imports into the U.S. surged from under 200 million pounds per year to over 3 billion pounds in 2023, raising concerns around origin fraud, subsidy eligibility and domestic feedstock displacement.
4. Climate Distortion
The deepest risk is not only economic. It is atmospheric.
When fossil or high-emission pathways are misdeclared as renewable, carbon ledgers become unreliable. The European Commission’s 2025 review of Chinese biodiesel fraud allegations did not confirm intent to defraud, but it did identify systemic weaknesses in supply-chain certification audits.
That matters.
Because if the audit system cannot guarantee traceability, climate accounting becomes fragile.
The conclusion is simple:
Fuel fraud is not leakage.
It is economic extraction through weak authentication.
This is why the sector must move beyond asking:
Is the fuel marked?
The better question is:
Can the molecule, feedstock, custody route, carbon claim and money trail be independently authenticated?
Marked is not enough.
Certified is not enough.
Authenticated is the new minimum.
Dr. Anju Sharma
Originally published on LinkedIn on 2026-06-24 16:41:21: https://www.linkedin.com/feed/update/urn%3Ali%3Ashare%3A7475588889861214208
Scope 2 Just Got a Shocker as TheCloud has developed a CarbonShadow.
Dr. Anju Sharma MrsSustainability
For years, corporate clean-energy accounting enjoyed a very convenient equation:
Annual electricity consumed = Annual renewable certificates bought = “100% renewable.
Elegant. ESG-friendly. Also increasingly uncomfortable.
A data centre may pull fossil-heavy power from the local grid at midnight, while its contracted solar project generates excess clean power at noon somewhere else.
On paper: clean.
On the wire: not always.
That is why the proposed GreenhouseGasProtocolScope2Reform matters.
The question is sharp:
Should clean-energy claims reflect real power use, in real grids, closer to real time?
Why this question has split Big Tech.
Google & Microsoft are backing the grid-realism view:
If electricity is consumed at 9 p.m. in one grid, the clean-power claim should also be proven around that time, in that grid.
Their logic is physical:
The grid does not run on annual averages.
Coal plants do not switch off because a certificate exists elsewhere.
The atmosphere does not wait for year-end reconciliation.
Hourly matching forces investment into the hard part of the transition:
✔ storage
✔ geothermal
✔ clean firm power
✔ nuclear
✔ transmission
✔ demand flexibility
✔ 24/7 carbon-free energy
Not just “buy green.
Prove green when the system is stressed.
Amazon, Meta, Salesforce & others are pushing the emissions-first view.
Their argument is also valid:
Carbon is global. Why trap climate capital inside local accounting boundaries if the same dollar can cut more CO₂ in a dirtier grid elsewhere?
A solar project in a coal-heavy region may avoid more emissions than another project in an already clean or solar-saturated grid.
That is not climate laziness.
That is climate finance with a calculator.
So the real fight is not BigTech versus BigTech.
It is:
✓Grid physics vs climate finance
✓Integrity vs scale
✓Local proof vs global impact
✓Carbon truth vs capital efficiency
✓Green claims vs grid outcomes
The old Scope 2 system created renewable demand. Credit where due.
Annual RECs built a bridge.
The problem is that some companies started calling the bridge a destination.
Now AI has changed the electricity equation.
AI is not weightless.
It has substations, cooling loads, grid queues, gas backup, transmission bottlenecks and carbon-accounting consequences.
So the smarter future cannot be accounting purism or certificate comfort.
It needs a phased model:
Annual matching = minimum floor
Hourly matching = direction of travel
Heavy power users = higher scrutiny
AI/data centres = grid-impact disclosure
Avoided emissions = reported separately
Legacy contracts = transition protection
Grid readiness = boardroom KPI
KtalystInsights™ MrsSustainability KtalystKeystone KtalystKlues™ Ktalyst5Ps5Es KtalystGreenLove Scope2 CleanEnergy CarbonAccounting
Source / shared link: https://www.reuters.com/sustainability/climate-energy/big-tech-splits-over-proposed-shake-up-clean-energy-accounting–ecmii-2026-05-26/?utm_source=chatgpt.com
Originally published on LinkedIn on 2026-06-03 13:04:58: https://www.linkedin.com/feed/update/urn%3Ali%3AgroupPost%3A82951-7467924291578228736
ESG2026: From GreenGloss to GovernanceGrade
Dr. Anju Sharma MrsSustainability
The old ESG report was often a polished sustainability scrapbook: green visuals, careful promises, and good intentions in premium formatting.
The 2026 ESG report is different.
✓Less brochure More backbone
✓Less assertion More assurance
✓Less green gloss More governance grade
With sharper questions
✓ Where did the data come from?
✓ Who owns the control?
✓ Has it been assured?
✓ Can it be traced across the value chain?
✓ Can it survive investor, auditor and customer scrutiny?
ISSB is setting the global ESG grammar.
IFRS S1 & S2 are bringing sustainability closer to enterprise value, climate risk, governance, strategy, metrics and targets.
The question is shifting from:
Do we have an ESG report?
to
Can our ESG data survive due diligence?
Water stress, biodiversity loss, land use & ecosystem dependency are no longer soft sustainability themes. A factory without water is not a green concern. It is a production stoppage wearing an ESG badge.
The form may reduce.
The evidence will remain.
July2026
ESG ratings are entering regulated territory.
Carbon data is becoming industrial language.
For steel, cement, aluminium, chemicals, automotive, batteries, textiles & logistics, the new operating questions are:
✓ Product carbon footprint?
✓ Carbon price paid?
✓ Verification trail?
✓ CBAM readiness?
✓ Customer audit defence?
Carbon is no longer only an emission number.
It is becoming a cost, pricing, procurement, margin and trade-compliance variable.
NamasteIndia is moving toward assurance-led ESG.
BRSR created the foundation. BRSR Core is pushing Indian companies toward more comparable, verifiable and assurance-ready ESG data.
This pressure will not stay at the listed-company level. It will move down the chain to MSMEs, exporters, logistics partners, packaging suppliers and raw material vendors.
KtalystGreenLens
ESG reporting is entering its grown-up phase.
The next advantage will not come from the thickest report.
It will come from the strongest sustainability operating system.
ESG is no longer decoration on the corporate strategy cake.
It is becoming the due diligence knife that cuts through it.
KtalystKlue™
The ESG report of the future will not ask:
How green do we look?
It will ask:
How much of our business model can survive verification?
Originally published on LinkedIn on 2026-05-17 14:34:00: https://www.linkedin.com/feed/update/urn%3Ali%3AugcPost%3A7461786098814316545
⚡ CarbonAccounting Isn’t Evolving. It’s Converging.
Dr. Anju Sharma | MrsSustainability
The scale it’s trying to capture is exploding:
✓ 37+ billion tonnes CO₂/year
✓ 22,000+ companies reporting
✓ 70–80% emissions in Scope 3
✓ 90%+ global GDP under net-zero
✓ ~23% emissions under carbon pricing
✗ Yet comparability is broken
→ That’s exactly what convergence is fixing
What’s shifting (2025–2027):
1️⃣ Beyond emissions → removals
✓ Land Sector Standard (2026); land use = ~22% emissions
✗ Carbon = emissions + removals
2️⃣ Electricity accounting reset
✓ Scope 2 overhaul impacts ~60% strategies
✓ Power = ~40% global CO₂
✗ “100% renewable” claims → audit zone
3️⃣ Corporate Standard rewrite
✓ First rebuild since 2004
✗ Built for a world with ~25% lower emissions
4️⃣ Finance × Carbon = merged
✓ $400T+ assets tied to climate disclosure
✓ IFRS S2 across 50+ jurisdictions
✗ ESG → balance sheet
5️⃣ Convergence, not control
✓ ISSB influences $100T+ capital markets
✗ No single rule-maker
6️⃣ Product carbon = one direction
✓ 80%+ emissions in supply chains
✓ CBAM impacts €150B+ trade
✗ Multiple footprints → ending
7️⃣ ISO × GHG Protocol = scale
✓ ISO used in 170+ countries
✗ Fragmentation → collapsing
8️⃣ Governance is merging
✓ CDP: 23,000+ companies | $67T+ market cap
✗ Silos → disappearing
9️⃣ Scope 3 = unavoidable
✓ Often up to 11x Scope 1+2
✗ “Minimum disclosure” = risk
🔟 Data layer is exploding
✓ ESG data market → $5–7B by 2027
✗ No interoperability = DataComa
1️⃣1️⃣ Claims under scrutiny
✓ 60%+ ESG claims under review
✗ Story > data = liability
1️⃣2️⃣ The real shift:
✓ Not one standard → a stack
→ Methodology + Disclosure + Governance + Data
✗ Waiting for “one framework” = already late
KtalystKlues (Structural Engineering Lens)
EmbodiedCarbon → Strength is not enough
BOQtoBOC → Quantity becomes carbon
CarbonBids → L1 → Low Carbon wins
DigitalCarbon → Track every tonne
CarbonCodes → No carbon = no approval
CBAMShift → Imports carry carbon price
GreenAssets → Low carbon = high value
CarbonFinance → Emissions decide interest
CoreShift
✓ Reporting → Regulation
✓ Regulation → Trade filter
✓ Trade filter → Competitive moat
Business excellence & sustainability will be led by those who measure precisely, translate intelligently, & build systems around carbon, because carbon is no longer an ESG metric, it is economic infrastructure.
Dr. Anju Sharma
Abbreviations
GHGProtocol: Greenhouse Gas Protocol
ISO: International Organization for Standardization
IFRSS2: Climate disclosure standard
ISSB: International Sustainability Standards Board
Scope1_2_3: Direct / energy / value chain emissions
CBAM: Carbon Border Adjustment Mechanism
CDP: Carbon Disclosure Project
EFRAG: European Financial Reporting Advisory Group
GRI: Global Reporting Initiative
SBTi: Science Based Targets initiative
PACT: Partnership for Carbon Transparency
MrsSustainability
KtalystInsights
KtalystKlues
DataComa
KtalystGreenLove
Ktalyst5Ps5Es
Originally published on LinkedIn on 2026-03-20 07:11:33: https://www.linkedin.com/feed/update/urn%3Ali%3Ashare%3A7440656261068763136
If_Scope2_Is_Dirty,Your_Hydrogen_Isn’t Clean
Dr. Anju Sharma
KtalystInsights™
SameElectrons SameBill DifferentBranding
Grey hydrogen is the older brother who shows his electricity bill.
e-Hydrogen? Same bill. Better outfit. Louder PR.
This week’s news makes this distinction important:
a Germany_China joint venture announced a large electrolyser manufacturing facility in Germany.
On paper, it’s being celebrated as progress for green hydrogen.
In reality, it’s progress for electrolysis capacity.
And that distinction matters.
Let’s stop debating colours and look at carbon accounting.
KtalystInsights™:
Hydrogen colours don’t describe molecules. They describe who pays for carbon and who postpones it.
Hydrogen types — stripped to facts
1) GreyHydrogen (SMR)
✓ Scope 1: 8–12 kg CO₂/kg H₂
✓ Scope 2: ~0.5–1 kg CO₂/kg H₂
✓ Carbon-heavy, but transparent
2) BlueHydrogen (SMR + CCS)
✓ Lower Scope 1 on paper
✓ Capture efficiency + methane leakage decide reality
✓ Carbon risk is engineering + verification
3) eHydrogen (Grid Electrolysis)
✓ Scope 1: ~0
✓ Scope 2: 15–22 kg CO₂/kg H₂ (EU grid)
✓ Often worse than grey on fossil-heavy grids
✓ Carbon doesn’t disappear — it moves to Scope 2
4) GreenHydrogen (Renewables + Electrolysis)
✓ Scope 1: ~0
✓ Scope 2: ~0
✓ Requires additional, renewable, time-matched power
✓ Still <1% of global hydrogen
5) TurquoiseHydrogen (Methane Pyrolysis)
✓ No CO₂ in reaction (solid carbon instead)
✓ Footprint depends on clean heat/electricity
✓ Promising — but early-stage
The uncomfortable truth
✓ Grey hydrogen owns its emissions
✓ Blue hydrogen promises reduction
✓ e-Hydrogen often outsources carbon to the grid
✓ Green hydrogen earns its colour — only with clean power
✓ Turquoise avoids CO₂ — but Scope 2 still decides
If your Scope 2 isn’t clean, your hydrogen isn’t green.
What cuts through colour codes
✓ Global hydrogen today: ~95–100 Mt/year
✓ >99% is fossil-linked
✓ Grid electrolysis: 15–22 kg CO₂/kg H₂
✓ Grey hydrogen: 8–13 kg CO₂/kg H₂
✓ >60% of hydrogen cost variability now comes from power price + grid carbon
KtalystKlues
Hydrogen won’t turn green through colour labels.
It will turn green when the grid does measurably, hourly, transparently.
Originally published on LinkedIn on 2026-01-03 04:16:28: https://www.linkedin.com/feed/update/urn%3Ali%3AgroupPost%3A1910576-7413070723436462080
🌍💸 KtalystInsights | CarbonMarkets: Strategy_Cracks
❝To reach NetZero, we need more than offsets—we need an A+ in climate credibility, starting with ABCD&E of MassBalance❞
Dr. Anju Sharma
📊 Authentic Accurate Data
→ Measured. Verified. Real. Climate action starts with what’s counted—accurately.
📏 Baseline Reference with start YR
→ No offset without a start line. A strong carbon credit begins with a scientifically sound baseline.
💸 CarbonCredit Integrity
→ One tonne in, one tonne out.
Mass balance is the climate ledger’s golden rule—every credited emission reduction must be physically and verifiably matched. No double-counting. No creative accounting. Just carbon math that balances.
🗑️ DataDustbin is Greenwashing
→ If it’s unverifiable, it belongs in the bin. Full traceability or no trade. No more shadow credits and sustainability theatre.
🌐 Ecosystem Harmony
→ Voluntary and compliance markets must speak the same language. The planet doesn’t differentiate—so why should we?
📉 Low-integrity credits = low impact + low trust.
But it doesn’t have to stay that way.
Originally published on LinkedIn on 2025-07-21 10:36:02: https://www.linkedin.com/feed/update/urn%3Ali%3AgroupPost%3A2474261-7353009855013568512
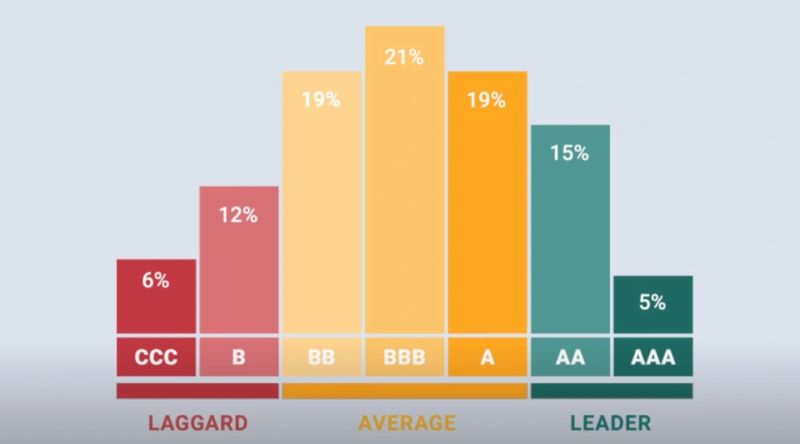
📚 KnowledgeSeries: Understanding MACI SustainabilityRatings
With ESG investing surpassing $40 trillion, sustainability metrics are no longer optional—they directly impact financial markets. But traditional ESG ratings often miss the biggest contributor to emissions: Scope 3 (supply chain & product lifecycle).
Enter MACI (Morningstar Absolute Carbon Impact)—a next-gen sustainability metric designed to measure real carbon impact, beyond corporate disclosures.
🔎 What is MACI?
📌 MACI (Morningstar Absolute Carbon Impact) is a carbon-focused rating that quantifies total emissions, unlike traditional ESG scores that rely on self-reported data.
✅ Scope 1 – Direct emissions from company operations
✅ Scope 2 – Indirect emissions from purchased energy
✅ Scope 3 – Supply chain & product lifecycle emissions (often 80-95% of total emissions)
📊 Only 5% of companies currently disclose full Scope 3 data, despite it making up 75% or more of their total carbon footprint. MACI ensures investors see the full picture.
🌍 Why is MACI a Game-Changer?
🟢 Exposes True Carbon Impact
📌 Over 90% of S&P 500 companies report ESG data, but less than 30% include Scope 3 emissions. MACI forces transparency by measuring actual environmental impact.
💰 Links Carbon Impact to Financial Risk
📌 Firms with high Scope 3 emissions face 10-15% valuation risks due to carbon pricing, regulation, and shifting consumer demand. Investors using MACI can identify & price these risks early.
📊 Goes Beyond Traditional ESG Ratings
📌 MSCI, Sustainalytics, & CDP rely on corporate sustainability claims—but MACI measures actual emissions data. This removes greenwashing from ESG scores.
🚀 Guides Net Zero Investments
📌 81% of global companies have Net Zero goals, but only 19% have credible transition plans. MACI identifies companies actually reducing emissions, ensuring investors back real sustainability leaders.
💡 How Financial Markets Depend on MACI
🏦 Sustainable Finance
📌 #$500 billion in Green Bonds & ESG Funds rely on sustainability scores. MACI ensures these funds actually reduce carbon impact.
📉 Investment Risk Assessment
📌 Climate risk is now considered a financial risk. Regulated markets (EU, US, UK, APAC) require stricter carbon disclosure. MACI helps investors assess exposure before risks impact stock prices.
📜 Regulatory Compliance
📌 The EU Taxonomy, SEC Climate Disclosures, & IFRS ESG Standards will require comprehensive Scope 3 reporting. MACI aligns with these frameworks, ensuring compliance-ready investments.
🔥 The Takeaway
As corporate greenwashing grows, investors need credible carbon metrics that go beyond PR campaigns. MACI is setting the new standard for data-driven sustainability investing.

Originally published on LinkedIn on 2025-02-27 01:47:03: https://www.linkedin.com/feed/update/urn%3Ali%3AgroupPost%3A9088131-7300692883345412096

