SUSTAINABILITY 3.0: SO WHAT ACTUALLY CHANGES?
Dr. Anju Sharma MrsSustainability
REPORTING asks:
Can you evidence what you claim?
RATINGS ask:
What does that evidence say about performance, risk & trajectory?
SUSTAINABILITY 3.0 asks:
Did the investment actually change the business & did the economics survive?
This is why I see sustainability moving through three generations:
ESG 1.0 — DISCLOSURE
Did you report it?
ESG 2.0 — RISK
Can you manage it?
SUSTAINABILITY 3.0 — PROOF-MAPPING
Can you connect the promise to operational evidence & economic value?
And this is where the difficult questions begin.
Can a company hold a strong ESG rating while its transition CapEx generates poor returns?
Yes.
Can another company deliver meaningful operational progress yet receive limited recognition because its evidence architecture is weak?
Also yes.
So the next sustainability advantage may not be the highest score.
It may be the ability to connect:
RATING → REALITY → ROCE
Because sustainability is no longer only about proving that a transition plan exists.
It is about proving that the transition is actually happening and that the business can economically sustain it.
That, for me, is Sustainability 3.0.
SIGNALS ARE ALREADY VISIBLE
📊 23 March 2026 — MSCI Model 5.0
MSCI moved further toward standardised quantitative assessment across areas such as carbon emissions, water stress, toxic emissions & waste, and health & safety — increasing the importance of measurable performance and trajectory.
⚖️ 2 July 2026 — EU ESG Ratings Regulation applies
ESG rating providers under the EU regime move into ESMA oversight, bringing greater scrutiny of methodologies, data sources, assumptions, governance and conflicts of interest.
But ratings are only one half of the change.
📑 REPORTING IS MOVING FROM NARRATIVE TO EVIDENCE
Reporting determines what evidence a company produces.
Ratings determine how that evidence is interpreted.
India illustrates the shift well.
BRSR Core coverage:
Top 150 → Top 250 → Top 500 → Top 1,000 listed companies in FY2026–27
The architecture is progressively moving toward more standardised KPIs, assessment/assurance and stronger evidence trails.
Europe adds another dimension.
1 January 2026 — CBAM entered its definitive regime.
For covered sectors, embedded-carbon information is no longer simply an ESG disclosure.
It increasingly carries commercial consequence.
Carbon Disclosure → Carbon Evidence → Carbon Cost
That is the real evolution.
Not more reporting.
Not another ESG score.
But the ability to prove that strategy, CapEx, operational outcomes, sustainability impact & economic returns actually connect.
That is Proof-Mapping.
KtalystInsights KtalystKlues™ MrsSustainability ESG BRSRCore TransitionEconomics SustainableFinance CapitalAllocation
Originally published on LinkedIn on 2026-09-02 17:06:03: https://www.linkedin.com/feed/update/urn%3Ali%3AgroupPost%3A2366091-7500962257556824064
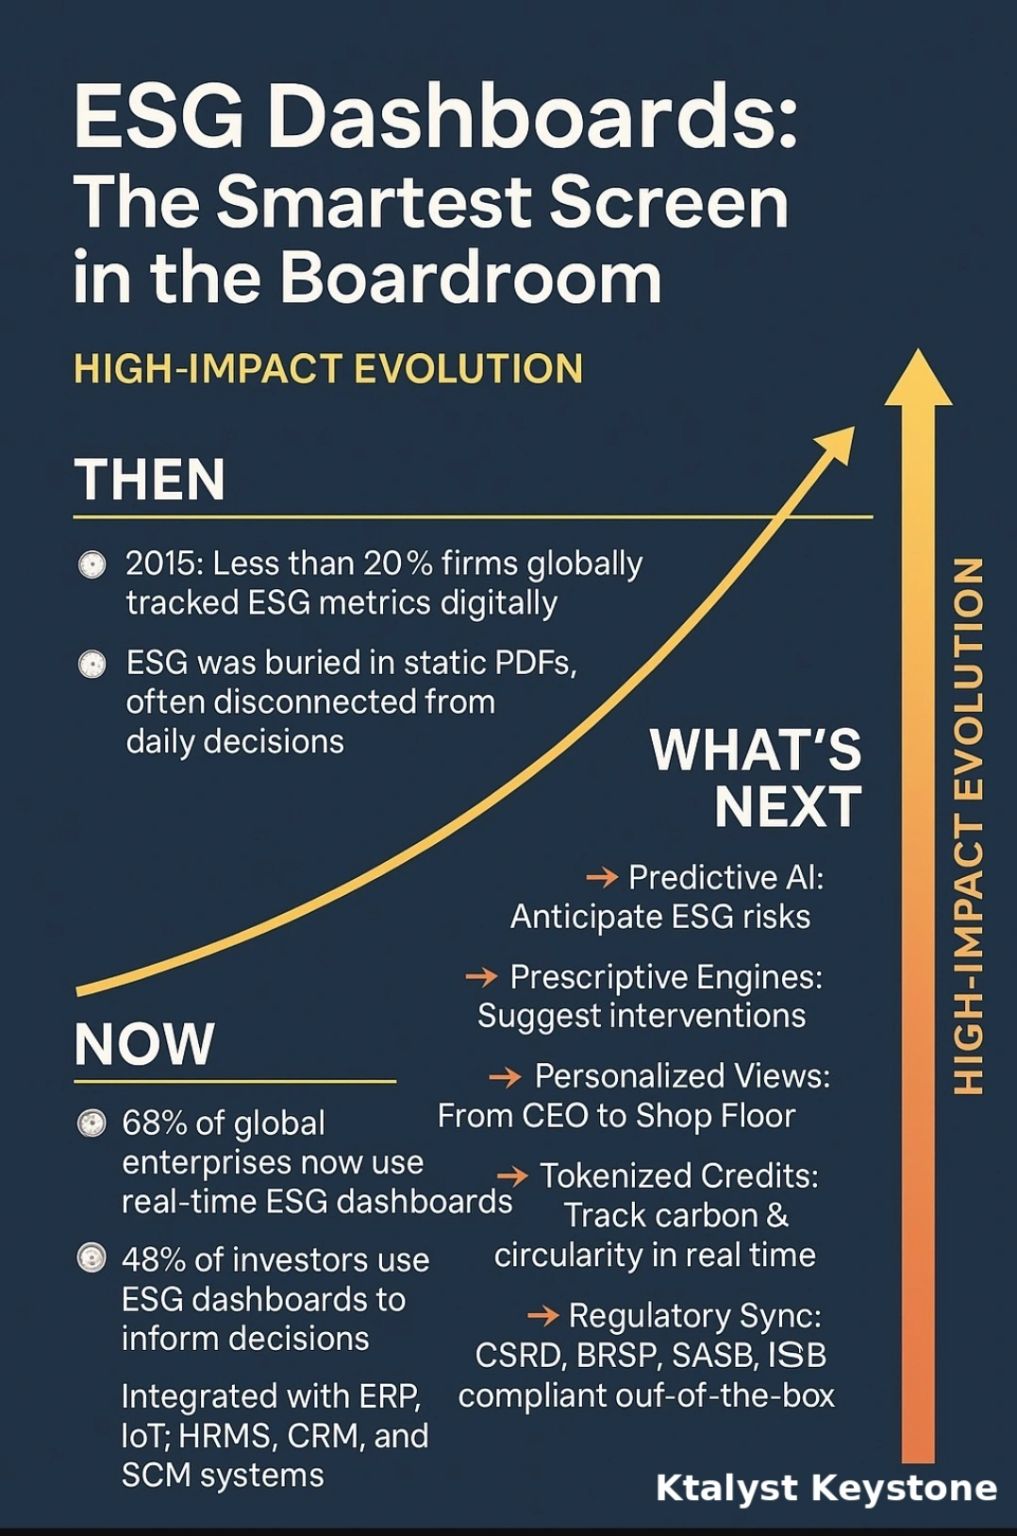
ESGDashboards: The Smartest Screen in the Boardroom
High-Impact Evolution Every Business Needs Now
WhyThisMatters
In today’s climate-conscious, capital-sensitive world—you can’t manage what you can’t measure.
Boards, investors, and regulators are demanding real-time, decision-grade ESG data.
That’s why ESGdashboards have moved from nice_to_have to non_negotiable.
Then: Static, Scattered & Slow
🕰️ In 2015, only 20% of firms tracked ESG metrics digitally (World Bank)
📄 ESG data was siloed, manual, and backward-looking
❌ No clarity, no comparability, no real impact
Now: Smart, Integrated & Boardroom-Ready
📊 68% of global enterprises now use ESG dashboards (Deloitte, 2024)
📈 48% of investors say dashboards influence funding decisions (EY Survey)
⚙️ Connected to ERP, IoT, HRMS, CRM & SCM tools—embedded into operations
Companies Leading the Dashboard Shift
UnitedStates
Microsoft → PowerBI ESG analytics for energy & emissions transparency
Apple → Supply chain dashboards tracking clean energy commitments
GM → Emissions & compliance dashboards tied to EV plant targets
BlackRock → Portfolio ESG risk visualization for client reporting
EuropeanUnion
Unilever → ESG KPI dashboard aligned with Sustainable Living Plan
Nestlé → Water, emissions, and supplier ethics dashboard
Volkswagen → ESG digital twin for Scope 3 and climate risk simulation
Santander → Sustainability-linked loan dashboard for B2B clients
China
Alibaba Group → AI-driven ESG data dashboard for carbon footprint reporting
BYD Auto → Battery lifecycle & emissions dashboards for global exports
Tencent → ESG platform linked to green finance initiatives
China Mobile → ESG compliance dashboard for 5G energy usage
India
Infosys → ESG command center tracking Scope 1–3 & renewable targets
Mahindra Group → Live water, energy, waste dashboards at plant level
Tata Steel → BRSR-linked ESG dashboard integrated with safety metrics
Adani Green → Renewable project progress dashboard with ESG risk overlays
What’sNext: Predictive, Prescriptive, Personalized
🧠 AI to anticipate ESG risks
⚡ Smart engines to suggest interventions
🎯 Role-based views from boardroom to shop floor
♻️ Tokenized credits for circularity & carbon tracking
✅ Auto compliance with CSRD, BRSR Core, ISSB, SASB
WhyActNow
Organizations with mature ESG dashboard systems report:
✅ 20% faster audit readiness
✅ 15% higher investor trust scores
✅ 30–40% lower ESG data processing cost
KtalystKeystone believes dashboards are not just reports.
They are your strategy radar, resilience compass, and stakeholder magnet.
If ESG isn’t on your screen, it’s probably off-track.


Originally published on LinkedIn on 2025-04-02 05:18:14: https://www.linkedin.com/feed/update/urn%3Ali%3AgroupPost%3A4023031-7313067213299625984

