WHEN_SHIT_STARTS_FLYING, FOLLOW THE CARBON.
Dr. Anju Sharma MrsSustainability
Village gobar gas was a near-perfect local loop:
Dung → Digester → Cookstove → Digestate → Soil
Waste became energy. Nutrients stayed local. Almost nothing moved.
IndustrialCBG changes the equation.
The moment a local manure loop becomes a centralised energy business, it acquires:
Aggregation → Trucks → Upgrading → Compression → Storage → Distribution → Digestate logistics
The chemistry is the same.
The carbon system is not.
TheHiddenCarbon
Take a 100 t/day plant sourcing wet biomass over an average 50 km.
100 t × 50 km = 5,000 tonne-km/day
At ~0.12 kg CO₂e/tonne-km:
→ ~220 t CO₂e/year
from loaded inbound freight alone.
Not counted:
Empty backhaul
Digestate return
Compression power
CBG distribution
Steel + concrete + plant equipment
And then comes methane.
Biogas/biomethane systems can lose around 2–5.5% of methane output across digestion, upgrading, storage & handling.
That can mean roughly:
1 t CH₄ produced → ~0.5–1.5 t additional CO₂e on a 100-year basis.
That is not an operational footnote.
It can materially erode the climate advantage before logistics, electricity & infrastructure even enter the ledger.
TheStrategicBlindSpot
The atmosphere does not distinguish between methane from a gas field & methane from a cowshed.
It responds to the molecule.
That is why the global biomethane debate is already moving from:
Renewable origin → Verified lifecycle performance
EU, UK, US, Denmark & Brazil increasingly focus on some combination of:
Feedstock eligibility | lifecycle GHG thresholds | methane leakage | chain-of-custody | actual emissions avoided
India should be asking the same question.
Capturing manure that would otherwise decay anaerobically & emit methane can create real climate value.
But:
Long feedstock radius + wet-biomass trucking + residue removal + methane slip + compression energy ≠ automatically green
PolicyInversion
If policy rewards:
Installed capacity + tonnes of CBG
the system optimises for volume.
If policy rewards:
Verified net CO₂e avoided
the system optimises for:
↓ Methane leakage
↓ Feedstock radius
↓ Fossil logistics
↑ Genuine waste diversion
↑ Digestate return
↑ Lifecycle carbon integrity
That is the difference between a bioenergy programme & a decarbonisation programme.
The real KPI should therefore be:
Net CO₂e avoided / unit of useful energy
Not merely tonnes of gas produced.
The full CarbonLedger must include:
Feedstock km | methane slip | transport fuel | compression power | digestate fate | soil-carbon impact | infrastructure footprint | counterfactual emissions
As once policy rewards capacity before carbon performance, the pattern becomes predictable:
Build first → Certify green → Audit later.
So when shit starts flying across districts:
Follow the carbon not the certificate.
Originally published on LinkedIn on 2026-08-09 16:10:45: https://www.linkedin.com/feed/update/urn%3Ali%3Ashare%3A7492251033277100032
Sunburn or SunBoom?
U.S. Slaps 3,521% Tariffs on Solar Imports — The SolarSector Feels the Heat (and Opportunity)
When the sun shines too bright on unfair play, tariffs bring the shade.” — KtalystInsight
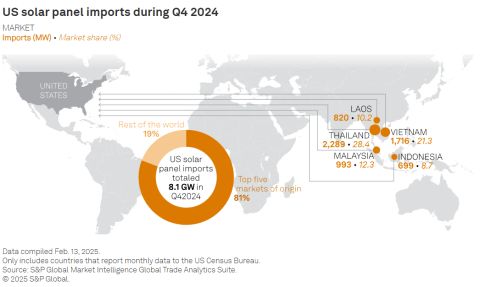
The UnitedStates has swung a solar sledgehammer — imposing tariffs as high as 3,521% on solar panel imports from Cambodia, Vietnam, Thailand, and Malaysia.
This stems from a Department of Commerce finding that Chinese companies were rerouting solar products through Southeast Asia to dodge existing duties.
Winners Emerging:
FirstSolar, Qcells, and other U.S. manufacturers celebrating a MadeInAmerica solar boom.
SolarBank CEO Dr. Richard Lu shared a sharp pivot — expanding domestic community solar and energy storage solutions, especially to feed the AI-driven data center boom.
SolarBank’s new 2.9 MW Gainesville, New York project is already under development.
Losers Worried:
Renewable project developers predict a 20–30% rise in project costs.
Supply chains could see 6–12 months delays, impacting Biden’s climate goals.
Global Echoes: Solar Under Trade Siege
EuropeanUnion’s CBAM (Carbon Border Adjustment Mechanism):
Though solar isn’t covered yet, solar supply chains are preparing for impact.
CBAM rollout from 2026 may push solar module prices up by ~10% if embedded carbon costs get added.
Manufacturers are already shifting wafer and polysilicon production to cleaner-energy countries like Canada and Brazil to avoid CBAM penalties.
India’s Solar Firewall:
Imposed 40% Basic Customs Duty on solar modules from April 2022 to promote Atmanirbhar Bharat.
Indian players like Adani Solar and Tata Power Solar are scaling local module capacity aggressively.
Canada’s Quiet Defense:
Continuing antidumping duties on Chinese modules, aiming to build a resilient domestic clean energy base.
Money Moves: Follow the Smart Investors
Brookfield Renewable Partners and BlackRock are pivoting funds into localized solar manufacturing and battery storage ecosystems.
NextEra Energy eyes major gains by scaling U.S.-based clean energy supply chains.
Ktalyst Perspective:
This tariff wave, plus the CBAM ripple effect, isn’t protectionism — it’s market redesign by climate necessity.
The winners will be solar companies that decarbonize supply chains, invest in local resilience, and pivot toward clean manufacturing clusters in NorthAmerica and India.

Originally published on LinkedIn on 2025-04-26 18:06:28: https://www.linkedin.com/feed/update/urn%3Ali%3AgroupPost%3A2153908-7321957853764677632
Why ESG Isn’t a Global Roadmap—It’s a Country_by_Country_Compass
ESG Isn’t One-Size-Fits-All—It’s One-Strategy-Fits-Nation
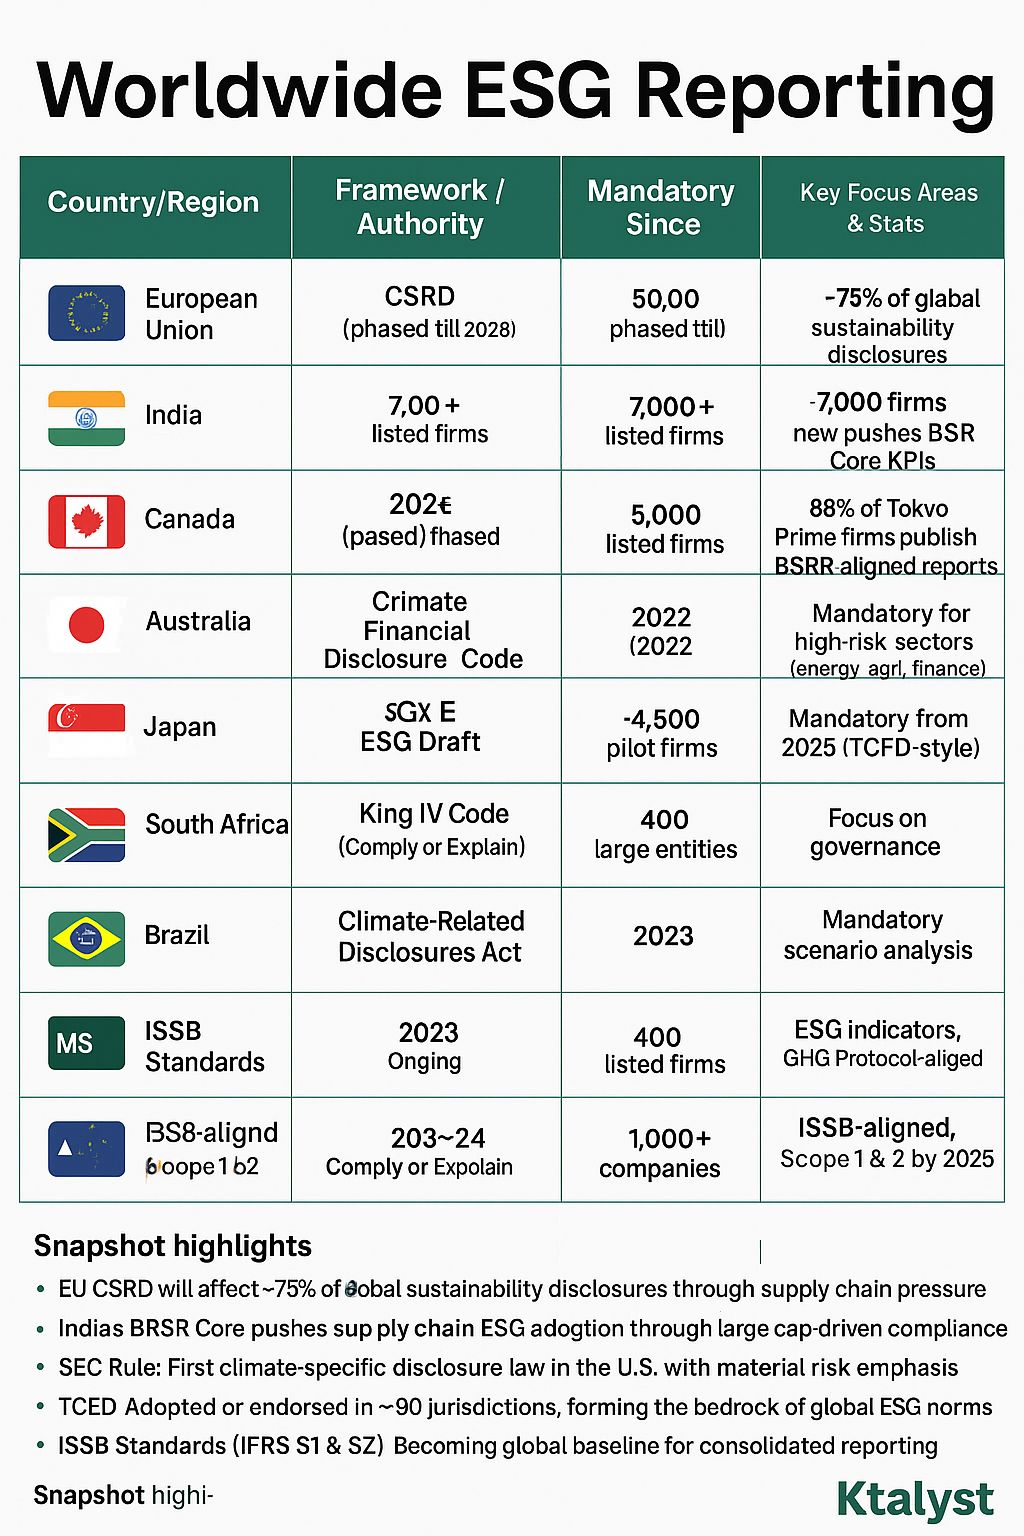
ESG reporting takes different roads because nations prioritize differently—economic maturity, regulatory style, investor pressure, and trade exposure all shape the path. The EU leads with CSRD—affecting 50,000+ firms through double materiality, taxonomy alignment, and mandatory assurance. The US sticks to financial materiality and climate risk, sidestepping Scope 3 and S&G. India’s BRSR ties ESG to development goals, starting with the top 1,000 and easing into assurance. Export-driven China, Malaysia, and Singapore accelerate ESG to meet global buyer expectations and bypass EU CBAM fallout. Japan prefers voluntary codes; South Africa excels in governance (King IV), but lacks integrated data.
Bottom line? ESG mirrors what each country values—growth, governance, global edge, or green capital. It’s not just compliance—it’s strategy, sovereignty, and survival.
🇪🇺 European Union
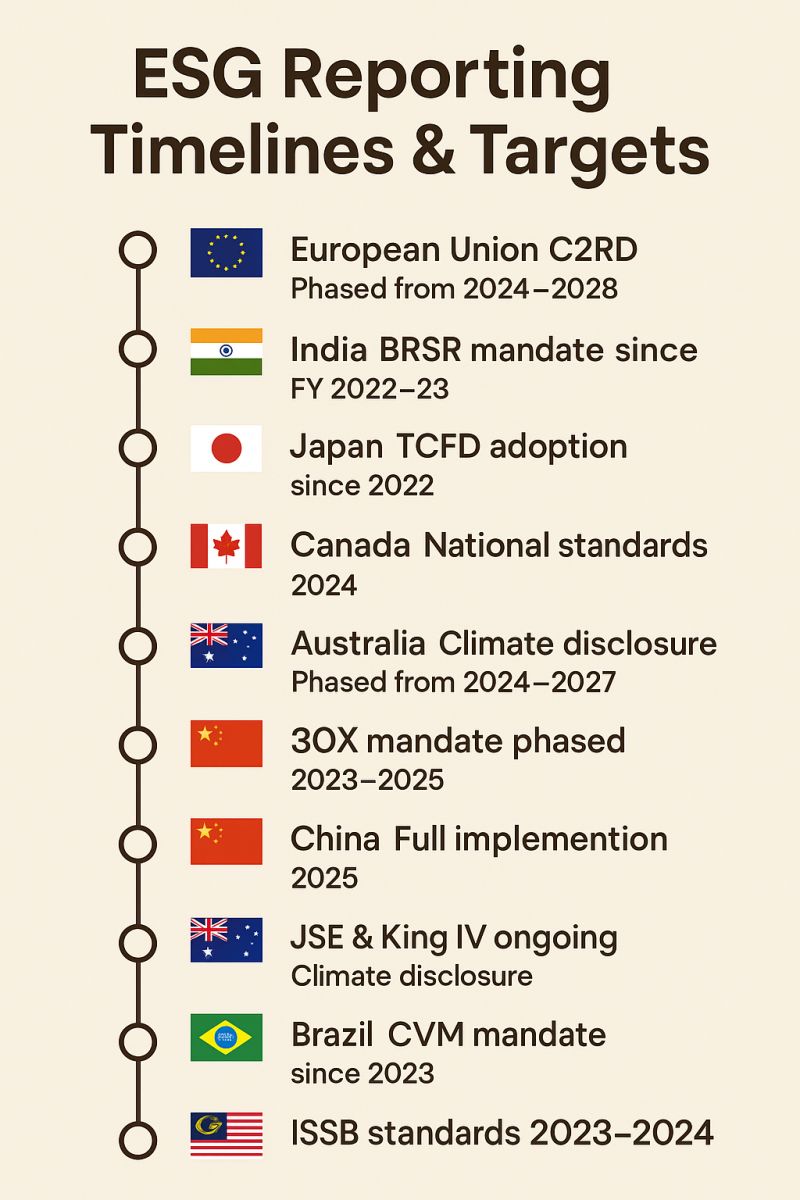
Timeline: CSRD phased from 2024 to 2028
Mandatory from:
2024: Large public-interest companies
2025: All large companies
2026–28: SMEs (limited scope)
FunFact: Will impact 75%+ of global ESG reporting indirectly via supply chains
🇺🇸 United States
Timeline: SEC Rule effective 2024–2025
Mandatory from:
FY2024: Large Accelerated Filers
FY2025: Accelerated Filers
Scope 3? Only if material (and still debated)
🇮🇳 India
Timeline:
BRSR mandatory since FY 2022–23
BRSR Core with limited assurance from FY 2023–24
Next up: Potential rollout for mid-size unlisted companies by 2026
🇯🇵 Japan
Timeline:
TCFD adoption by Prime listed firms since 2022
No fixed law, but >80% of large firms are already onboard voluntarily
🇨🇦 Canada
Timeline:
CSA rule aligned with TCFD from 2024
Mandated for:
Publicly listed entities, expanding coverage gradually
🇦🇺 Australia
Timeline:
Climate Disclosure Framework phased from July 2024
Rollout:
2024: Large companies
2026–27: Mid and small entities
🇸🇬 Singapore
Timeline:
SGX ESG reporting mandatory since 2023
Sector phased:
Energy, Agri, Finance by 2024
All others by 2025
🇨🇳 China
Timeline:
Draft ESG rules under CSRC in 2024
Target:
Full mandatory rollout by 2025
Pilots ongoing in green finance and energy sectors
🇿🇦 SouthAfrica
Timeline:
JSE & King IV apply ongoing since 2016
Mandate:
Comply or explain” model, no fixed year — but tightening expected by 2025
🇳🇿 NewZealand
Timeline:
Climate-Related Disclosure Act enforced from 2023
Applies to:
Financial institutions & large corporates (>NZ$1B AUM or turnover)
🇧🇷 Brazil
Timeline:
CVM ESG disclosure mandatory since 2023
Focus:
Annual reporting, with increasing pressure for Scope 3 inclusion by 2026
🇲🇾 Malaysia
Timeline:
ISSB-aligned standards adopted in 2023–2024
Mandated by:
Bursa Malaysia, full Scope 1–2 by 2025, Scope 3 optional till 2026


Originally published on LinkedIn on 2025-04-21 21:59:46: https://www.linkedin.com/feed/update/urn%3Ali%3AugcPost%3A7320204627323289601
KnowledgeSeries: The Future of CarbonCredits – A USD250B Market by 2050
The carboncredit market is no longer a side conversation—it’s becoming a mainstream financial instrument. With projections hitting #$250B by 2050, businesses and investors must pay attention.
Why? Because companies that integrate NetZero strategies today will gain a competitive edge, while those that don’t will face higher costs, regulatory risks, and shrinking investor confidence.
🌎 The Carbon Credit Boom: Why It’s a Business Imperative
✔️ The voluntary carbon market is set to grow 15X by 2030, reaching #$10B–$40B. (McKinsey)
✔️ Investments in carbon credits hit #$1.7B in 2023, up 50% YoY. (BloombergNEF)
✔️ 6,000+ global companies have set Science-Based Targets (SBTi), driving demand for verified carbon offsets.
✔️ Indonesia, Brazil, and Kenya are integrating carbon markets into their economies, generating revenue from forests, renewable energy, and carbon capture projects.
✔️ Article 6 of the ParisAgreement is enabling international carbon credit trading, boosting market credibility.
🚀 What does this mean for businesses?
✔️ A carbon credit strategy is no longer optional—it’s a business necessity.
✔️ Companies without a decarbonization plan will face higher compliance costs.
✔️ Investors are prioritizing NetZero leaders, making carbon credits a key ESG performance driver.
📊 Who’s Leading the Carbon Credit Race?
✔️ Big Tech & Carbon Capture:
Meta, Microsoft, and Google are securing multi-million-dollar deals in Direct Air Capture (DAC) to future-proof their carbon strategies.
✔️ Financial Institutions Going Green:
BlackRock, JP Morgan, and Goldman Sachs are launching climate-focused funds, treating carbon credits as an emerging asset class.
✔️ Corporate Adoption Soaring:
40%+ of Fortune500 companies are embedding carbon offsets into their business models.
✔️ Government-Led Action:
The EU, Singapore, and Japan are developing regulated carbon exchanges to ensure transparency & standardization.
🌱 What to Expect in 2025 & Beyond?
✔️ Stricter Regulations → Carbon credit verification will be tighter, reducing low-quality offsets & greenwashing risks.
✔️ Rising Prices → As demand outstrips supply, carbon credit prices could triple by 2030, making early adoption a smart financial move.
✔️ Emerging Markets in Play → Africa, Southeast Asia, and Latin America will dominate nature-based carbon solutions (reforestation, soil carbon, etc.).
✔️ Carbon as a Tradable Asset → Institutional investors are pushing for liquid carbon credit markets, making carbon a financialized commodity.
🔍 ComingUpNext: “The Business Case for Carbon Credits – Risks, Rewards & Strategy
Originally published on LinkedIn on 2025-03-08 07:02:05: https://www.linkedin.com/feed/update/urn%3Ali%3AgroupPost%3A82951-7304033651044839424
🌟 GlobalVoices at Davos2025: Key Day 1 Highlights
🇺🇸 UnitedStates: Focused on AIInnovation, TradePolicy shifts, and balancing growth with Regulation.
🇮🇳 India: Showcased GreenEnergy leadership and AffordableAI for global equity.
🇪🇺 EuropeanUnion: Advocated for AIGovernance and reaffirmed NetZero commitments.
🇨🇳 China: Highlighted GreenTech advancements and multilateral EconomicRecovery.
🇯🇵 Japan: Announced HydrogenTechnology investments and championed ResponsibleAI.
🌍 Africa: Pushed for ClimateFinancing and access to DigitalTransformation.
🇧🇷 Brazil: Demanded stricter AmazonProtection and increased ClimateAid.
🇬🇧 UnitedKingdom: Focused on EthicalAI and boosting RenewableEnergy.
🇦🇺 Australia: Emphasized ClimateResilience and AIDriven solutions.
📊 Key Statistics from Davos2025
Billionaires’ wealth grew 3x faster in 2024 than the global average, spotlighting widening EconomicInequality.
Protests highlighted the influence of concentrated wealth and power, including concerns over figures like Donald Trump and Elon Musk.
Geopolitical shifts dominated discussions, with the inauguration of the 47th U.S. President shaping global trade dialogues.
KeyTakeaways: United on AI, Sustainability, and GlobalCollaboration for a better future.
WEF Leadership Innovation
Originally published on LinkedIn on 2025-01-20 12:51:20: https://www.linkedin.com/feed/update/urn%3Ali%3AugcPost%3A7287089315162058752
Global Leaders in Ethanol Blending in Fuel: India’s Role and Achievements
NamasteIndia ranks among the top ethanol producers globally, alongside the US and Brazil. Tops Countries
1. US: The largest producer and consumer of ethanol, Production: 876K barrels Consumption 838K barrels per day.
2. Brazil: Produces 403K barrels per day and consumes 359K barrels per day.
3. China: Produces and consumes 43K barrels per day.
4. Canada: Produces 33K barrels per day; consumes 41K barrels per day.
5. France: Produces 17K barrels per day & consumes 13 thousand barrels per day.
6. Germany: Produces 13K barrels per day and consumes 27K barrels per day.
7. Colombia: 8.5K barrels/day (produces), 6.1K barrels/day (consumes).
8. Thailand: 8.1K barrels/day (produces), 9.1K barrels/day (consumes).
9. Guatemala: 8K barrels/day (produces).
10. Spain: 7.9K barrels/day (produces), 8K barrels/day (consumes).
11. Belgium: 6.8K barrels/day (produces), 1.8K barrels/day (consumes).
12. India: 5.3K barrels/day (produces & consumes).
13. Australia: 5.3K barrels/day (produces), 5.1K barrels/day (consumes).
14. UK: Produces 4.3 thousand barrels per day and consumes 17 thousand barrels per day.
India’s Ethanol Blending in Gasoline Industry
Key_Facts_&_Figures
Ethanol Blending Target: India aims to achieve 20% ethanol blending in gasoline by 2025, a goal accelerated from the original target of 2030.
Current Blending Level: As of May 2024, India has achieved a 15% ethanol blending rate.
Economic Impact: A successful ethanol blending program can save India approximately $4 billion (₹30K crore) annually by reducing oil imports.
Production Volume: India plans to produce around 10 billion liters (1,000 crore liters) of ethanol to meet the 20% blending target.
Role of Key Stakeholders
Government:
Policy Framework: The government has implemented policies like the National Policy on Biofuels.
Pricing and Incentives: The government administers ethanol prices and provides incentives to encourage production and blending.
Oil Marketing Companies (OMCs):
Procurement: OMCs issue annual tenders to procure ethanol from producers.
Blending and Distribution: OMCs blend ethanol with gasoline at designated depots and distribute the blended fuel to retail stations.
Sugar Industry:
Production: The sugar industry is a major producer of ethanol, utilizing by-products like molasses. Leading companies include Bajaj Hindusthan Sugar Ltd., Balrampur Chini Mills Ltd., Shree Renuka Sugars Ltd., and Dhampur Sugar Mills Ltd., contributing significantly to the total ethanol production.
Environmental impact: supports bioenergy production and waste utilization but also faces challenges like high water usage and pollution.
Originally published on LinkedIn on 2024-09-25 05:31:06: https://www.linkedin.com/feed/update/urn%3Ali%3AgroupPost%3A60128-7244579146016641026
NamasteIndia ranks 6th in the top 14 countries producing wind power as of 2023, along with their percentage increase in wind power capacity over the last 10 years:
1. China: 885 TWh (+190%)
2. United States: 425 TWh (+70%)
3. Germany: 137 TWh (+40%)
4. Brazil: 95 TWh (+210%)
5. United Kingdom: 82 TWh (+60%)
6. India: 71 TWh (+50%)
7. Spain: 60 TWh (+30%)
8. France: 45 TWh (+80%)
9. Canada: 35 TWh (+50%)
10. Italy: 30 TWh (+25%)
11. Sweden: 28 TWh (+90%)
12. Australia: 25 TWh (+120%)
13. Turkey: 22 TWh (+100%)
14. Netherlands: 20 TWh (+150%)
Future_Potential:
China: Exceptional wind resources due to its large land mass and long coastline.
United_States: Vast areas with high wind speeds, especially in the Midwest.
Germany: Consistent wind flow in the North Sea region.
Brazil: Strong wind flow in coastal regions.
United Kingdom: Excellent wind conditions, particularly offshore.
India: Significant potential in coastal areas like Tamil Nadu and Gujarat, and hilly regions such as Himachal Pradesh.
Countries with Untapped Wind_Power_Potential:
Russia: Despite significant wind potential, it generated less than 1% of its electricity from wind in 2023.
Japan: Has strong wind resources but has not fully developed its wind power infrastructure.
South_Korea: Similar to Japan, it has good wind potential but limited development.
These countries have the right wind conditions to further increase their wind power capacity in the future.
Originally published on LinkedIn on 2024-09-19 10:31:36: https://www.linkedin.com/feed/update/urn%3Ali%3Ashare%3A7242480441604161536

