TheChemical_Industry generated ~USD57billion in net profits and invested ~USD73billion in CAPEX in YR2024, yet TSR remains structurally weak. WHY?
Dr. Anju Sharma
KtalystInsights™ MrsSustainability
KtalystKlues
This is not a DemandParadox; it is a ValueCapture problem.
1) The industry is still profitable
✓ Global Top-50 chemical companies reported #~USD57billion net profit in 2024
✓ Average sector EBITDA margins ~12–15% for large integrated players
✓ A majority of listed chemical companies remained cash-positive despite margin pressure
KtalystInsights:
Profitability exists; this is not a demand-led downturn.
2) Capital investment has not stopped
✓ Global chemical CAPEX in 2024: ~USD73billion (Top-50 companies)
✓ R&D spend grew ~2–4% YoY in 2024 despite earnings pressure
KtalystInsights:
Industries facing structural demand decline do not sustain this level of investment.
3) Volumes are growing faster than pricing
✓ Global chemical market size grew from #~USD6.18trillion (2024) to #~USD6.32trillion (2025E)
✓ Packaging, electronics, mobility & construction chemicals showed #~1.5–3% volume growth
✓ Real pricing power across bulk and semi-specialty chains remained flat to negative
KtalystInsights:
Demand growth exists, but value per unit has diluted.
4) TSR is weak because capital intensity has risen
✓ Chemical sector 5-year TSR ~2–3% p.a. vs #~8–9% for MSCI World
✓ Average CAPEX-to-sales ratio increased ~150–250 bps vs pre-2015 levels
✓ Energy transition and ESG CAPEX raised fixed costs without near-term pricing upside
KtalystInsights:
Returns compress when each dollar of profit requires more capital.
5) Overcapacity is real—but uneven
✓ China accounted for #~40%+ of global new petrochemical capacity additions (2019–2024)
✓ Utilisation in multiple commodity chains remains #~70–80%, below mid-cycle norms
✓ Specialty chemicals show #~40–50% lower EBITDA volatility vs commodity chemicals
KtalystInsights:
McKinsey’s conclusion fits commodity and aging specialty chains, not the entire sector.
6) Segment data shows divergence, not uniform decline
✓ Regulation-linked chemicals often sustain ROIC in the high-teens to low-20% range
✓ Application-embedded specialties outperform sector TSR by ~300–500 bps
✓ Commodity chemicals trend at or near cost of capital
KtalystInsights:
The issue is business-model selectivity, not sector weakness.
7) What McKinsey measures vs what boards must decide
✓ McKinsey evaluates relative investor returns (TSR)
✓ Boards must manage absolute cash generation and capital efficiency
✓ Demographics support demand; strategy decides economic rent
KtalystInsights:
Chemicals are essential—but not all are equally rewarded.
> This is not a low-demand cycle.
It is a high-capital, low-pricing-power environment.
Dr. Anju Sharma
KtalystInsights™ MrsSustainability Chemicals Strategy ValueCapture TSR BoardroomLens DataComa
Originally published on LinkedIn on 2025-12-28 10:35:57: https://www.linkedin.com/feed/update/urn%3Ali%3Ashare%3A7410991894211543040
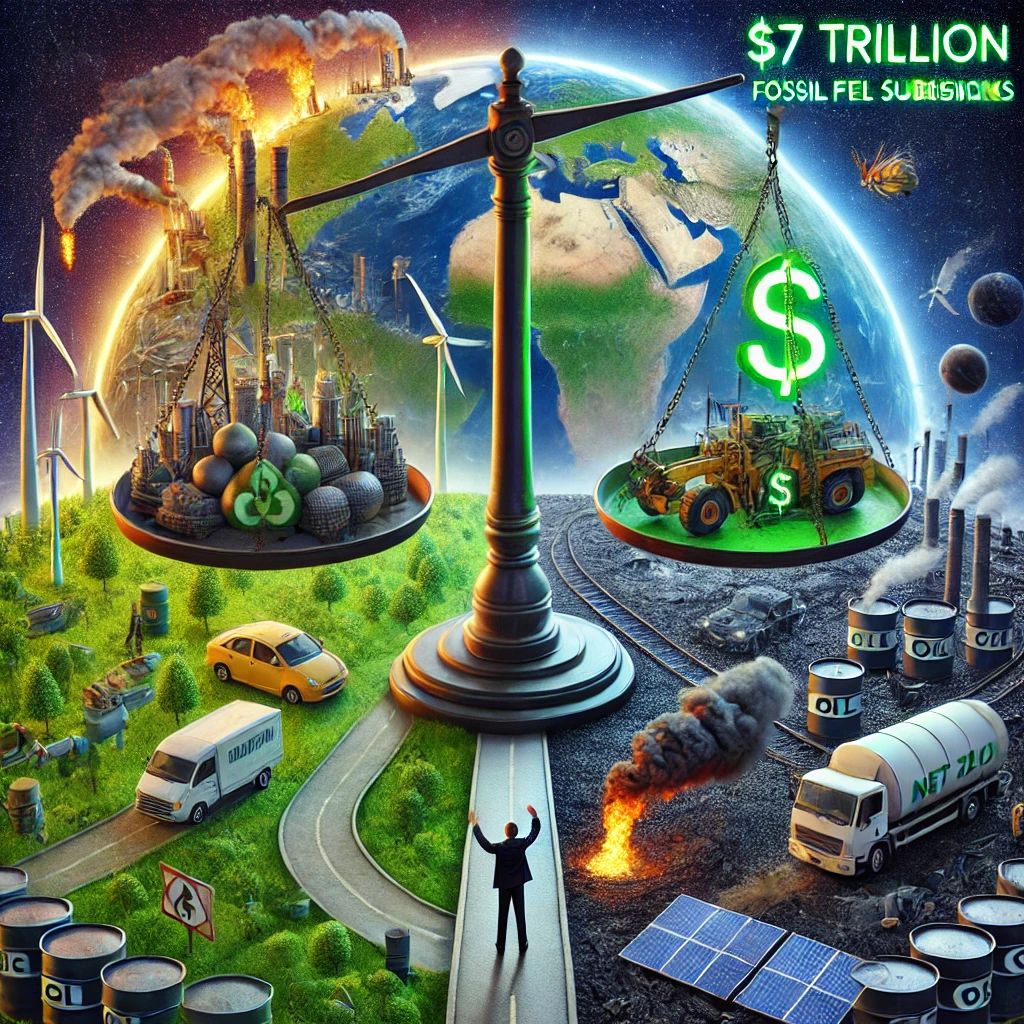
🚨 “The USD_7 Trillion Green Paradox: Saving the Planet or Fueling the Crisis?” 🌍♻️💰
📊 1. The Green Investment Paradox: More Money, More Emissions
✅ #$1.7 trillion invested in clean energy in 2023 (IEA, 2024)
❌ #$7 trillion in fossil fuel subsidies were paid out in 2023 (IMF, 2024)
✅ 120+ countries pledged net-zero targets
❌ Only 20% have actual policies & execution plans (Net Zero Tracker, 2024)
❌ CO₂ emissions hit a record high of 37.5 billion tons in 2023 (Global Carbon Budget, 2024)
🚨 Reality Check: For every $1 spent on green energy, $4 still funds fossil fuels.
🇩🇰 Denmark: 75% renewables, carbon-neutral by 2045 (EPI, 2024)
🇸🇪 Sweden: 98% recycling rate, world leader in circular economy (WEF, 2024)
🇳🇴 Norway: 80% of new car sales are EVs, hydro-powered energy (IEA, 2024)
🇪🇺 EU: #€1 trillion Green Deal investment, strict carbon pricing (EU Commission, 2024)
🚨 Reality Check: Even the greenest nations rely on imported fossil fuels & high energy consumption.
🟡 3. The Green Economy Paradox: Investing While Polluting
🇨🇳 China: World’s largest renewable energy investor, but 55% of power still comes from coal.
🇮🇳 India: Fastest-growing solar market, but remains the third-largest CO₂ emitter. (MNRE, 2024)
🇺🇸 USA: #$369B Inflation Reduction Act to fund green tech, but oil production reached a record 13.1M barrels/day in 2023. (DOE, 2024)
🚨 Reality Check: Countries are investing in renewables but not cutting fossil fuel use fast enough.
🔴 4. The Worst Green Offenders: Promises Without Action
❌ 🇦🇺 Australia: The world’s second-largest coal exporter, despite ‘green economy’ branding. (Climate Council, 2024)
❌ 🇷🇺 Russia: No net-zero plan, fossil fuel revenue = 40% of its economy. (UNEP, 2024)
❌ 🇸🇦 Saudi Arabia: Announced $260B for renewables but still earns 90% of its GDP from oil. (IEA, 2024)
🚨 Reality Check: Without emission cuts, green projects don’t fix the problem.
📉 5. The Harsh Truth: Emissions Are Still Rising
❌ 2023 was the hottest year ever recorded, with global temperatures 1.48°C above pre-industrial levels. (NASA, 2024)
❌ Carbon capture tech only offsets 0.1% of annual global emissions. (IPCC, 2024)
❌ At current transition rates, the world will miss its 1.5°C climate target by 2040. (UNEP, 2024)
🚨 Reality Check: We must cut global emissions 43% by 2030 to stay on track—but we’re nowhere close.
🏆 KeyTakeaway
The Green Economy paradox is real—we invest in sustainability while financing fossil fuels even more. Until green investments outpace fossil fuel spending, and emissions actually drop, we’re not in a real transition.
Originally published on LinkedIn on 2025-02-03 04:11:43: https://www.linkedin.com/feed/update/urn%3Ali%3AgroupPost%3A82951-7292031979921797120

