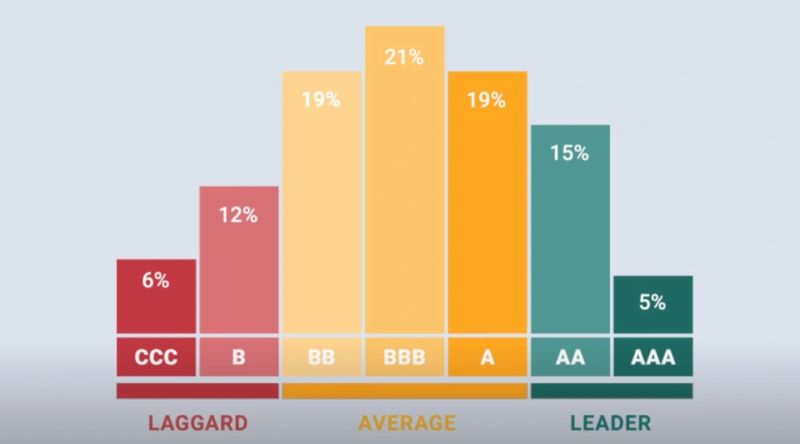
📚 KnowledgeSeries: Understanding MACI SustainabilityRatings
With ESG investing surpassing $40 trillion, sustainability metrics are no longer optional—they directly impact financial markets. But traditional ESG ratings often miss the biggest contributor to emissions: Scope 3 (supply chain & product lifecycle).
Enter MACI (Morningstar Absolute Carbon Impact)—a next-gen sustainability metric designed to measure real carbon impact, beyond corporate disclosures.
🔎 What is MACI?
📌 MACI (Morningstar Absolute Carbon Impact) is a carbon-focused rating that quantifies total emissions, unlike traditional ESG scores that rely on self-reported data.
✅ Scope 1 – Direct emissions from company operations
✅ Scope 2 – Indirect emissions from purchased energy
✅ Scope 3 – Supply chain & product lifecycle emissions (often 80-95% of total emissions)
📊 Only 5% of companies currently disclose full Scope 3 data, despite it making up 75% or more of their total carbon footprint. MACI ensures investors see the full picture.
🌍 Why is MACI a Game-Changer?
🟢 Exposes True Carbon Impact
📌 Over 90% of S&P 500 companies report ESG data, but less than 30% include Scope 3 emissions. MACI forces transparency by measuring actual environmental impact.
💰 Links Carbon Impact to Financial Risk
📌 Firms with high Scope 3 emissions face 10-15% valuation risks due to carbon pricing, regulation, and shifting consumer demand. Investors using MACI can identify & price these risks early.
📊 Goes Beyond Traditional ESG Ratings
📌 MSCI, Sustainalytics, & CDP rely on corporate sustainability claims—but MACI measures actual emissions data. This removes greenwashing from ESG scores.
🚀 Guides Net Zero Investments
📌 81% of global companies have Net Zero goals, but only 19% have credible transition plans. MACI identifies companies actually reducing emissions, ensuring investors back real sustainability leaders.
💡 How Financial Markets Depend on MACI
🏦 Sustainable Finance
📌 #$500 billion in Green Bonds & ESG Funds rely on sustainability scores. MACI ensures these funds actually reduce carbon impact.
📉 Investment Risk Assessment
📌 Climate risk is now considered a financial risk. Regulated markets (EU, US, UK, APAC) require stricter carbon disclosure. MACI helps investors assess exposure before risks impact stock prices.
📜 Regulatory Compliance
📌 The EU Taxonomy, SEC Climate Disclosures, & IFRS ESG Standards will require comprehensive Scope 3 reporting. MACI aligns with these frameworks, ensuring compliance-ready investments.
🔥 The Takeaway
As corporate greenwashing grows, investors need credible carbon metrics that go beyond PR campaigns. MACI is setting the new standard for data-driven sustainability investing.

Originally published on LinkedIn on 2025-02-27 01:47:03: https://www.linkedin.com/feed/update/urn%3Ali%3AgroupPost%3A9088131-7300692883345412096
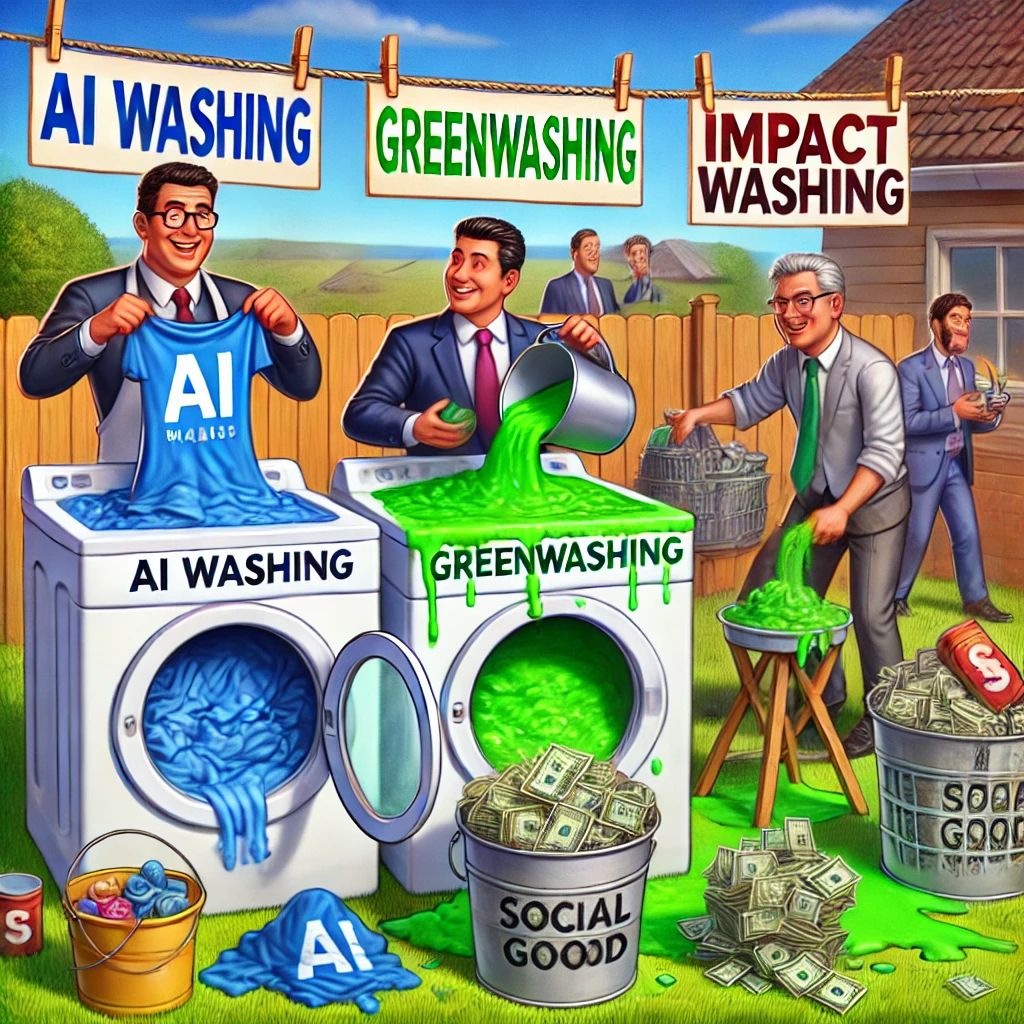
🚨 “The Corporate Hattrick of Deception: AI Washing, Greenwashing & Impact Washing!” 🤖💚🌍💸
If corporate Greenwashing was a sport, they’d be playing in the finals every year!
Just when AI Washing and Greenwashing weren’t enough, a third player has emerged—Impact Washing. Companies are not just misleading on AI and Sustainability, but also inflating their ‘SocialImpact’ to attract Investors and dodge scrutiny.
In 2025, these deceptive practices have led to Billions in InvestorLawsuits, RegulatoryCrackdowns, and GreenFinanceMisallocations across US, EU, China, India, and Asia.
📊 The Hattrick of Corporate Washing & Global Case Studies
🛑 1. AI Washing: The ArtificialIntelligence Illusion
🚨 75% of firms claiming AI leadership lack real AI adoption. (MIT Sloan, 2025)
🚨 InvestorLawsuits for AI deception doubled in 2024. (Stanford Law, 2025)
📌 Case Studies:
🔹 US: Tesla’s “Full Self-Driving” Fraud 🚗 – #$2.3B lawsuit for misleading AI claims. (SEC, 2025)
🔹 China: Fake AI CarbonTracking 📊 – #$1.1B in GreenBonds issued for fabricated AI-based EmissionsMonitoring. (Nikkei Asia, 2025)
🌱 2. Greenwashing: The FakeSustainability Playbook
🚨 #$1.3 Trillion in ‘Sustainable’ investments exposed as misleading. (EU GreenFinance Report, 2025)
🚨 60% of ‘CarbonNeutral’ pledges lack ScientificValidation. (UNEP, 2025)
📌 Case Studies:
🔹 EU: Volkswagen’s EV Greenwashing 🚗 – #€500M fine for false CarbonSavings claims. (European Commission, 2025)
🔹 India: Adani Group’s “CarbonNeutral” Ports 🚢 – #₹8,200 crore ($1B) GreenBond probe. (SEBI, 2025)
🔹 Asia: FastFashion’s “EcoFriendly” Lie 👗 – #$780M in Penalties for misleading “100% Sustainable” fabric claims. (Reuters, 2025)
💸 3. Impact Washing: The ESG & SocialResponsibility Mirage
🚨 Only 17% of companies reporting ‘SocialImpact’ actually measure it. (WEF, 2025)
🚨 #$400B in ESG funds reclassified due to FalseClaims. (Morningstar, 2025)
📌 Case Studies:
🔹 US: Meta’s “EthicalAI” Ad Controversy 📱 – #$500M lawsuit over manipulative AI-driven ads. (Bloomberg, 2025)
🔹 India: Tata Group’s “InclusiveHiring” Scandal 🏭 – #₹2,100 crore ($250M) Penalty for inflating Diversity stats. (Economic Times, 2025)
🔹 China: ESG Failures in Tech SupplyChains 🏭 – #$3B InvestorPullout due to ForcedLabor revelations. (SCMP, 2025)
🏆 KeyTakeaway
🤖 AI Washing could be a powerful force for Innovation—if used Ethically.
🌍 Greenwashing should be eliminated with strict Regulations.
💸 Impact Washing would be the next BillionDollar Scandal if unchecked.
📌 Reality Check: Investors and Consumers must demand Transparency—not just PRSpin!
💬 Which of these Corporate Washings have you spotted? Drop your thoughts below! 👇
Originally published on LinkedIn on 2025-02-18 11:39:42: https://www.linkedin.com/feed/update/urn%3Ali%3AgroupPost%3A4385073-7297580537215434754
GoogleDropsDEITargets: What Does It Mean for the Future of Inclusive Hiring?
📢 BreakingNews: Google has officially ended its diversity hiring targets, stating it will no longer have #”aspirational goals” for workforce representation. This move follows legal and political pressures around DEI (Diversity, Equity, and Inclusion) initiatives, particularly for federal contractors.
📊 TheBackdrop
🔹 DEI hiring practices aimed to increase representation across underrepresented groups in the workforce.
🔹 90% of Fortune 500 companies have dedicated DEI programs.
🔹 Diversity-driven companies outperform industry benchmarks by 35% in financial returns (McKinsey).
🔹 75% of job seekers consider workforce diversity an important factor in choosing an employer (Glassdoor).
🔄 WhatChanges at Google?
📌 No more workforce representation targets → Google will stop setting hiring quotas based on diversity metrics.
📌 Reviewing DEI programs → Existing policies and hiring practices are under internal review.
📌 Retaining inclusion efforts → Google states that it will continue supporting employee resource groups and build inclusive products.
⚖️ TheLargerDebate
✅ Proponents say:
✔️ Encourages merit-based hiring rather than diversity quotas.
✔️ Reduces legal risks amid growing scrutiny on DEI initiatives.
⚠️ Critics argue:
❌ DEI targets hold companies accountable for inclusive hiring.
❌ Without targets, diversity progress may slow down in male-dominated sectors like tech.
🚀 WhatNext?
With Google redefining its diversity strategy, will other tech giants follow?
👥 Is this a step toward equal opportunity or a setback for workplace diversity?
Drop your thoughts below! ⬇️
DiversityMatters HiringTrends WorkplaceInclusion CorporateStrategy
Originally published on LinkedIn on 2025-02-06 11:43:22: https://www.linkedin.com/feed/update/urn%3Ali%3Ashare%3A7293232805738651649
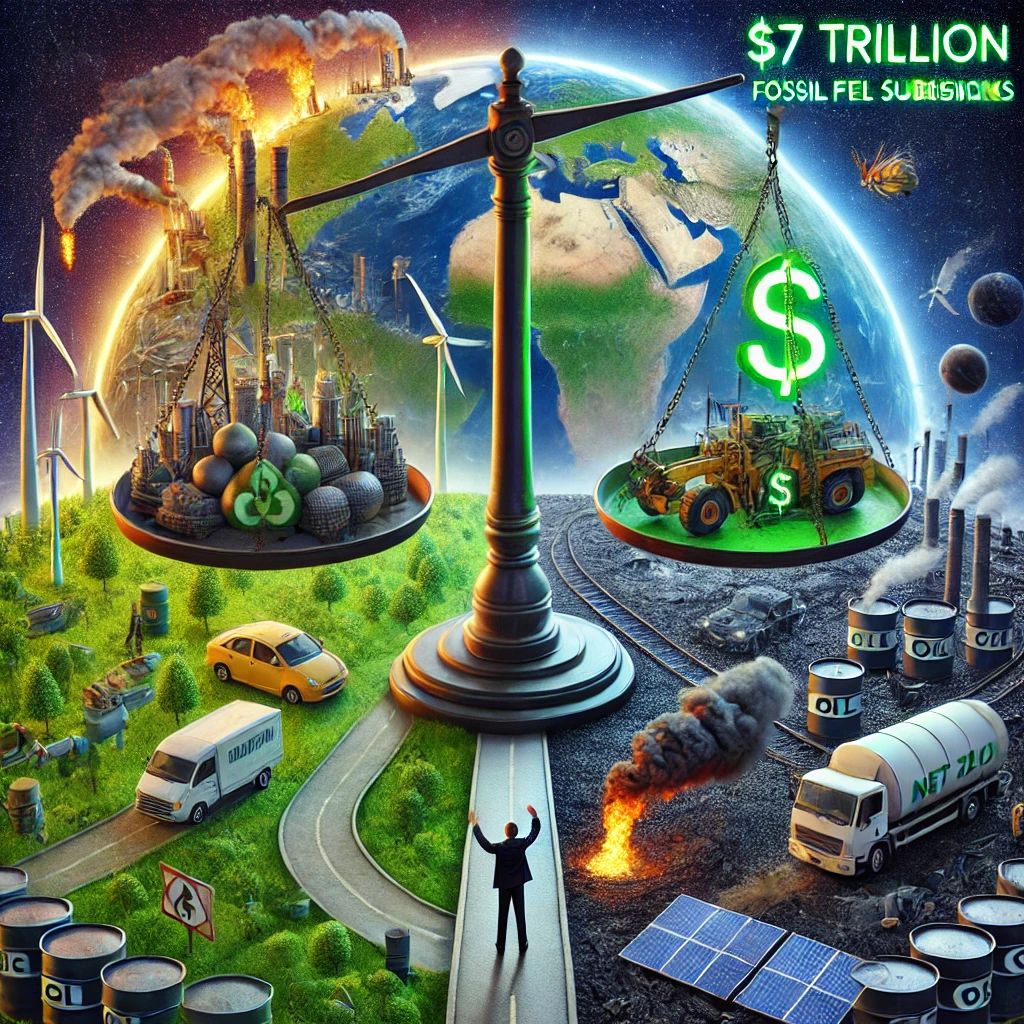
🚨 “The USD_7 Trillion Green Paradox: Saving the Planet or Fueling the Crisis?” 🌍♻️💰
📊 1. The Green Investment Paradox: More Money, More Emissions
✅ #$1.7 trillion invested in clean energy in 2023 (IEA, 2024)
❌ #$7 trillion in fossil fuel subsidies were paid out in 2023 (IMF, 2024)
✅ 120+ countries pledged net-zero targets
❌ Only 20% have actual policies & execution plans (Net Zero Tracker, 2024)
❌ CO₂ emissions hit a record high of 37.5 billion tons in 2023 (Global Carbon Budget, 2024)
🚨 Reality Check: For every $1 spent on green energy, $4 still funds fossil fuels.
🇩🇰 Denmark: 75% renewables, carbon-neutral by 2045 (EPI, 2024)
🇸🇪 Sweden: 98% recycling rate, world leader in circular economy (WEF, 2024)
🇳🇴 Norway: 80% of new car sales are EVs, hydro-powered energy (IEA, 2024)
🇪🇺 EU: #€1 trillion Green Deal investment, strict carbon pricing (EU Commission, 2024)
🚨 Reality Check: Even the greenest nations rely on imported fossil fuels & high energy consumption.
🟡 3. The Green Economy Paradox: Investing While Polluting
🇨🇳 China: World’s largest renewable energy investor, but 55% of power still comes from coal.
🇮🇳 India: Fastest-growing solar market, but remains the third-largest CO₂ emitter. (MNRE, 2024)
🇺🇸 USA: #$369B Inflation Reduction Act to fund green tech, but oil production reached a record 13.1M barrels/day in 2023. (DOE, 2024)
🚨 Reality Check: Countries are investing in renewables but not cutting fossil fuel use fast enough.
🔴 4. The Worst Green Offenders: Promises Without Action
❌ 🇦🇺 Australia: The world’s second-largest coal exporter, despite ‘green economy’ branding. (Climate Council, 2024)
❌ 🇷🇺 Russia: No net-zero plan, fossil fuel revenue = 40% of its economy. (UNEP, 2024)
❌ 🇸🇦 Saudi Arabia: Announced $260B for renewables but still earns 90% of its GDP from oil. (IEA, 2024)
🚨 Reality Check: Without emission cuts, green projects don’t fix the problem.
📉 5. The Harsh Truth: Emissions Are Still Rising
❌ 2023 was the hottest year ever recorded, with global temperatures 1.48°C above pre-industrial levels. (NASA, 2024)
❌ Carbon capture tech only offsets 0.1% of annual global emissions. (IPCC, 2024)
❌ At current transition rates, the world will miss its 1.5°C climate target by 2040. (UNEP, 2024)
🚨 Reality Check: We must cut global emissions 43% by 2030 to stay on track—but we’re nowhere close.
🏆 KeyTakeaway
The Green Economy paradox is real—we invest in sustainability while financing fossil fuels even more. Until green investments outpace fossil fuel spending, and emissions actually drop, we’re not in a real transition.
Originally published on LinkedIn on 2025-02-03 04:11:43: https://www.linkedin.com/feed/update/urn%3Ali%3AgroupPost%3A82951-7292031979921797120
NamasteGreenIndia’s Power Mix 2024: Renewables Surge Amid SlowestGrowth Since Pandemic
KeyStats
🟩 GrowthRate: Power output grew by 5.6%, the slowest since the pandemic.
⚡ CoalShare: Coal contributed 74.4% of total power generation, slightly down from 75% in 2023.
🌞 RenewableEnergyContribution: Renewables formed 12.1% of total power generation.
🌬️ WindEnergy: Added 3.5GW, reaching a total installed capacity of 48.16GW.
💧 HydropowerGrowth: Output increased by 4%, recovering from a 13.7% decline in 2023.
🔋 SolarEnergy: Added 24.5GW, boosting total capacity to 97.86GW.
EnergyMixHighlights
🟨 Coal: 212.3GW installed capacity (45.96% of total).
🟦 Renewables: Total capacity reached 209.44GW (15.84% YoY growth).
💧 Hydropower: 46.93GW capacity.
🌞 Solar: 97.86GW capacity.
🌬️ Wind: 48.16GW capacity.
KeyTakeaways
🌧️ WeatherImpact: Unseasonal rains reduced cooling and irrigation energy demand.
📉 EconomicSlowdown: Industrial hubs reported muted power consumption.
🔄 RenewableChallenges: Variability in solar and wind generation impacted output.
VisualSummary
🟩 RenewableCapacityGrowth: 209.44GW (15.84% YoY growth).
🟧 CoalDominance: 74.4% of power mix.
🌬️ WindEnergyGrowth: 3.5GW added.
🌞 SolarEnergyExpansion: 24.5GW added.
💧 HydropowerRecovery: 4% output growth.
India is steadfast in achieving its 500GW renewable energy capacity by 2030, balancing EnergySecurity, IndustrialGrowth, and ClimateAction.
Let’s connect and discuss how sustainableenergy is shaping the future of EnergyTransition.
Originally published on LinkedIn on 2025-01-14 12:59:12: https://www.linkedin.com/feed/update/urn%3Ali%3AgroupPost%3A2368335-7284916965930864640

